

So what is this compositeness scale which experiments have tried to evidence or rule out ? It is basically an indication of the length scale at which quarks still appear point-like: the higher the compositeness scale, the smaller is the size of the features one tries to evidence.
Be assured that we have no clue of what lies within a quark. Quarks might very well be pointlike, and as such they are described in the standard model. But if they had an internal structure of dimensions testable with the energetic probes we are using (other quarks or gluons), we would be experiencing yet again the marvel of Lord Rutherford, as he saw the alpha particles with which he was bombarding a gold foil rebounding back as if they had hit something really hard inside the atom.
The experimental signature at the LHC is the observation of high-energy jets of hadrons -the manifestation of quarks violently thrown out of their parent proton- which are emitted at large angle from the proton beams. Without attempting to be fancy, one may just count how many events contain jet pairs emitted close to the beam axis and how many contain jet pairs emitted orthogonally. The ratio of the latter divided by the former is an estimator only marginally less good than more refined ones to the presence of a structure within the quark.
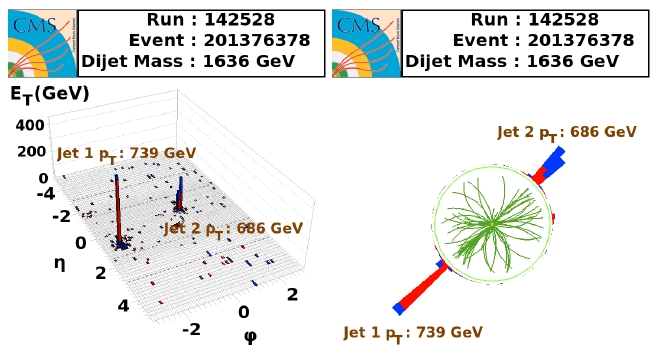
CMS studied the ratio of central to non-central dijet pairs at the highest energy allowed by the still comparatively small statistics available from the first few months of LHC collider operations. One of the highest-energy dijet events is shown below, in two separate views. On the left the calorimeter system has been cut sideways and unrolled on a plane, such that the energy deposits corresponding to the two energetic jets can be seen as clusters of calorimeter cells -the higher, the more energetic. On the right, you are looking at the detector as if you were proton in the beam. The streams of tracks emitted at two well-defined directions transversely are measured in the silicon tracker, and correspond of course to the two energy deposits in the calorimeter system.
The observed "centrality ratio" is found by CMS in good agreement with calculations that use quantum chromodynamics as the sole ingredient, and no eccess of central dijet events is present at the highest probed energies. The distribution is shown below. The x axis shows the dijet invariant mass, which is the best measure we have of the "hardness" of the collision.
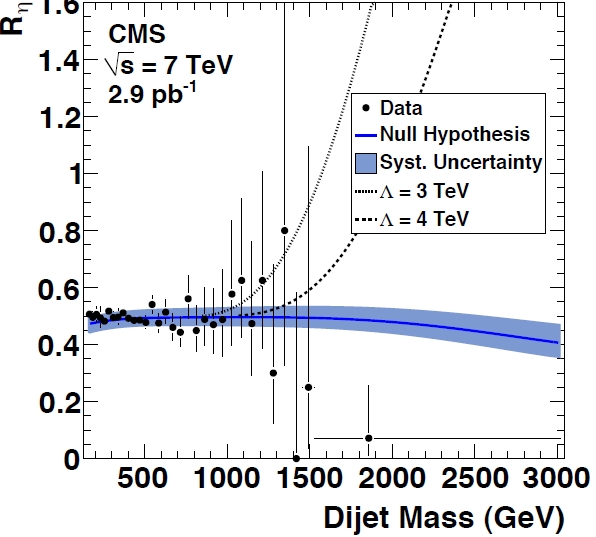
As you can see, the existence of a substructure in the quarks would evidence itself as a rapid growth of the ratio R (dashed curves) above the characteristic energy scale at which quarks reveal their hypothetical interior. Instead, experimental data (the black points with error bars) show a very flat distribution, indicative of no quark substructure and in good agreement with QCD predictions (the blue band). A limit-setting procedure utilizing the CL_s method allows to set a 95% confidence-level limit on the scale of quark substructure at 4.0 TeV, as shown in the graph below.
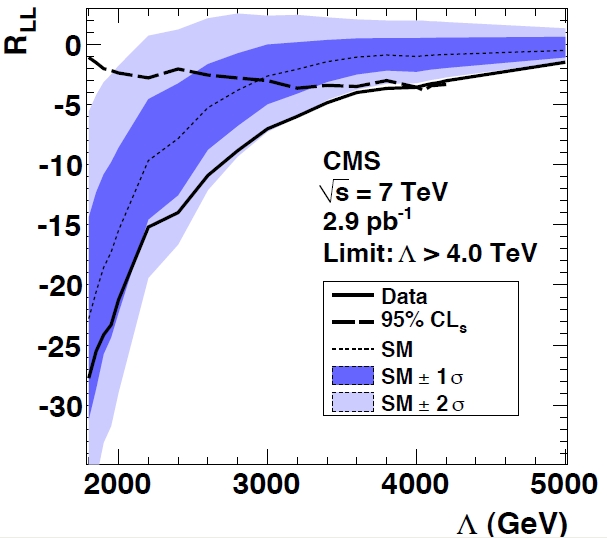
The figure is rather complicated to explain, so I will explain it only if you manifest your interest in its details in the comments thread below. To extinguish the curiosity of most of you suffices to observe that, due to some downward fluctuation of the experimental data, CMS is able to set a limit on the compositeness scale higher than what they expected to set: the "expected limit" can be read off at the point where the center of the dark blue band (dashed) crosses the CL_s curve (wider-dashed), and it is at 2.9 TeV. Whether CMS was "lucky" to set a limit higher than what on average their analysis and data would warrant, or whether we should take an impartial stand and just observe that there does not appear to be a compositeness signal below 4 TeV, is your pick. To me, the competition with ATLAS has little or no value: what matters is that we get to understand more of the world we live in. And this result does its little bit in the right direction.


Comments