

Hadronic Jets: what are they ?
Jet production at hadron colliders is a complex, fascinating topic that has been at the center of the stage in high-energy physics for forty years now, and does not seem to be retiring any time soon. A jet is a collimated stream of particles --light hadrons such as pions and kaons, but also other particles with long or infinite lifetime (protons, neutrons, photons)-- that is produced when a quark or a gluon emerges from a subnuclear reaction. These things cannot live naked, since they carry a unobservable quantum number called colour, and they "dress up" into colourless objects by recombining with other quarks and gluons. This creates several hadrons, that may be collimated into a narrow spray if the originating quark had a very high momentum.
Hadronic jets were first observed in the mid seventies at Stanford, and resulted from head-on collisions of electrons and positrons of few GeV. Back then quarks had just been accepted as real entities when the discovery of the J/ψ particle proved their existence, and it was a quite striking thing to see them "emerging" from the hard collision of two leptons. The process occurs when the electron and the positron annihilate, creating a virtual photon. The photon then materializes into anything that is not forbidden by physical laws; in some cases, a pair of quarks!
If the energy is low, the quarks still hadronize, but they just create several light hadrons that will leave in all directions: no jet production occurs, because most of the energy is spent in the creation of the particles. In other words, the quark-antiquark pair created by the virtual photon do not have enough momentum that can be transferred to the hadrons they form. So in the early seventies the angular distribution of the hadrons was almost isotropic, spherical, and one could interpret it without the need of quarks. Only by raising the collision energy a jetty structure started to be visible. This was the first direct confirmation of the quarks' existence.
Since then, jet physics has made several quantum leaps. The gluon was discovered as a third jet in those same kinds of events, and then quantum chromodynamics (QCD) became an accepted, and a more and more refined, theory that was capable to explain the behaviour of quarks and gluons. The comparison of QCD calculations with observed phenomena increased the precision of theoretical models, and little by little physicists grew capable of producing very precise simulations of the process by means of which quarks and gluons turn into these streams of collimated particles.
Quantum Chromodynamics, hard and soft
There exist two regimes in the phenomena that are studied. A "hard" regime is the one involving the energetic processes which take part at the deep core of the particle collision, where the energy is high in comparison with the mass of the lightest hadrons. In the hard regime we can use quantum chromodynamics to perform exact, quantitative calculations to predict e.g. angular distributions, energy, and other kinematical characteristics of events with jets. And then there is a "soft" regime, much more mysterious, that characterizes the processes of low energy which take place when quarks decelerate and "dress up" into colourless hadrons.
The soft "fragmentation" stage is not calculable with quantum chromodynamics, and is the one which determines fine details such as the distribution of particles within a jet and their multiplicity. We sort of understand what is going on because we can use simplified models of the mechanisms at work; then, by comparing their output with our observation we can tune them and make them very realistic. The problem, though, is that these models work until they work - once a new experiment investigates wholly different experimental conditions these models may fail and need to be re-tuned.
Of course this is not optimal when an experiment searches for new physics and needs to look for subtle deviations of observed phenomena with model predictions! To make just a telling example, in 1996 the CDF collaboration observed an increased rate of production of energetic pairs of jets, and some in the collaboration attempted to interpret the deviation as a first hint of new physics, which could take the form of a compositeness of the quarks: if quarks had been composite objects, indeed an increased rate is what one would have observed.
The effect went away when a re-tuning of the simulations with more room for hard gluons in the proton (a rearrangement of the so-called "parton distribution functions" which are an important input of the models) was produced. No new physics, doh. So you well understand that even for discovery physics it is crucial that the details of jet production and the input to the models which are compared to the data be known as well as possible.
In general, hadron collisions are uglier and dirtier than electron-positron collisions I discussed at the start of this article, but we nowadays use hadron probes to push our discovery reach to the highest possible energies, so we need to understand jet production in that environment. If you smash together two protons at high energy, as the LHC does, you usually obtain two to several jets of hadrons, and the processes you need to study are complex because you are not just colliding a pointlike object with another as in the case of electrons and positrons, but bags of these objects all together.
A way out is to restrict the study to relatively simpler processes, where there is a characterizing entity accompanying the jets. The cleanest thing we can use for this is the Z boson. Z bosons can be identified extremely cleanly when they decay into electron-positron or muon-antimuon pairs; by studying the jets produced in association with Z bosons in relation with the kinematical properties of the Z we are able to obtain quite precise measurements of jet production in a sort of "controlled environment". Further, the production of the Z boson is by itself a hard process for which theorists can produce very reliable calculations, so this allows us to "factorize" the problem and learn more of the part of the event we wish to study.
The new ATLAS measurement
So it turns out that the ATLAS collaboration produced a very complete study of the properties of jet production in association with Z bosons. You can find the paper in the Arxiv here, but if you are not a physicist you are probably better off by just looking at the figure which I pasted below. It is one of the many graphs contained in the ATLAS paper, and describes the kinematics of the fourth-leading jet (the jet with the fourth-highest transverse momentum in the event) in Z boson production events. Of course we are talking with 4-jet events here: events with fewer jets do not contribute to the selected sample.
[ Why transverse momentum as a criterion to order jets ?, you could ask. Right. We use transverse momentum rather than momentum to order jets because it is the component of the momentum in the direction orthogonal to the beam which is carried by the quark originating the jet. The longitudinal component does not carry information on how strong was the force kicking the quark out of the interaction point, because the interaction itself "moves" along the beam axis with a unknown momentum, due to the varying fraction of momentum carried by the quarks that initiated the reaction.
Hmm cryptic, ain't it ? Okay let me retry. You have two protons hitting one another. What actually creates the energetic reaction is a quark in one proton and a antiquark in the other proton, the two "hard objects" that actually release the bulk of the energy. Each of these carries a unknown amount of momentum, so that the "center of mass" of the reaction can be moving either way, just as if you have a truck traveling at 50 mph hitting head-on a subcompact car traveling at 50 mph. Physicists are interested in the debris flying away with significant speed in the direction orthogonal to the collision point, because that is what gives information about the speed of the two projectiles; the longitudinal kinematics are undetermined.]
Okay, now I will stop talking. Here is the picture: the data (black dots) are compared with several models on a semi-logarithmic scale in the top portion, and the ratio between the data and the three best models is shown in the lower part. You can see that we have reached an excellent level of understanding of the details of jet production, if we can model well even the kinematics of the fourth jet, which is much more affected by non-leading effects.
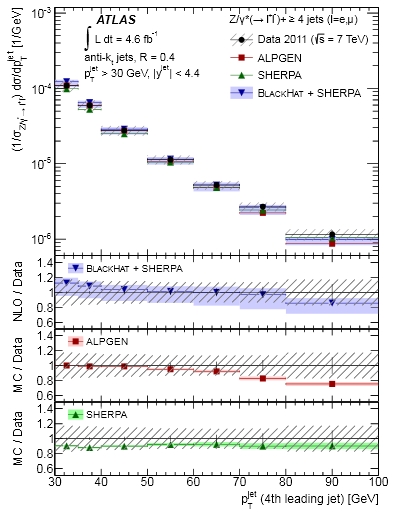 The hatched bands show the total experimental uncertainty in the ratios, while the coloured ones describe the model uncertainty. One observes that the agreement of Sherpa with the data in this particular distribution is the best one. [More on this evaluation below].
From the agreement of this and other distributions produced by ATLAS and CMS, model builders can tune their tools - in the hope we can find a disagreement which is due to something really new!
Appendix
You might well be asking what led me to give you my conclusion on which model is better above, so I think it is a good idea to answer this straight away.
You: "How can you say that Sherpa agrees best with the data above ?"
Me: "Look at the ratios: the ratio Sherpa/data is the flatter of the three."
You: "But Sherpa underestimates the data in all the bins! ALPGEN does a better job in the first four bins, and also the BLACKHAT/data ratio is overall more consistent with 1.0."
Me: "Right. But the shaded band shows a systematic uncertainty which is correlated across the x axis. To move all the points up and down by the half-width of that band one just needs to pay one standard deviation - one unit in the total chisquared. Be careful with correlated systematics - they trick you into overestimating statistical effects!"
You: "So you mean to say that the shape is more important than the normalization here ?"
Me: "Not necessarily. It is, if there is a large normalization error, which -although I confess I did not read the paper- is highly likely in this circumstance. I am exercising my gift of guessing from the graph what the experimental situation is, but I am usually right when I do so."
You: "You could be wrong, though - if the systematic band were showing uncorrelated uncertainties then Sherpa would not be the best model here."
Me: "Sure, I could be wrong. And the band could even not be showing the systematics, but just be an artifact of anti-aliasing in the graphic file. I repeat, I did not read the paper!! If you want to be sure, read it and let me know!"


Comments