

In the history of the discovery of climate change and its causes, there are many pioneers whose work in relevant areas is all but forgotten. Some of these people are not widely known. Others are widely known, but their climate-related work tends to lie forgotten in the archives. For example: Edison is famous as an inventor and Langley is famous as an aviation pioneer, but both men made little-known contributions to our knowledge of heat.
Modern scientific knowledge of the relationship between Sun, Earth and climate begins with the 16th century gentleman philosopher, George Best , who seems to have grasped the idea that heat is re-emitted from any surface on which sunlight falls and is then affected by our atmosphere. The exact nature of heat was a great puzzle to philosophers until - as predicted by Émilie du Châtelet in 1738, it was found that the spectrum which had been discovered by Isaac Newton was but the visible part of a wider spectrum of energy.
Fast forward now to 1821, when Ignaz Venetz demonstrated evidence of multiple past glaciations. He suggested that these had been caused by past variations in temperature. Before we can discuss the causes of temperature change we must agree on the meaning of the term 'temperature'. Heat and temperature are often confused. In fact, as remarked by Émilie du Châtelet, our sense of heat is so course and untrustworthy as to lead us quite astray in the matter of what heat is. It was the invention of the thermometer, she observed, that led us to understand that heat and temperature are two entirely different things.
As an aside to my main theme here, it may interest my readers to know that Émilie du Châtelet cited an experiment which anyone can perform to prove just how unreliable is our sense of temperature. If you keep one hand in hot water and the other in cold water until they have become accustomed to the temperatures, and then put both hands in luke-warm water: the hand that was in cold water reports 'hot' and the hand which was in hot water reports 'cold'. That sensory illusion experiment was reported by John Locke*, but not in terms suggesting it was his idea, so it was likely to have been widely known already amongst philosophers.
[*] - John Locke, Essay Concerning Human Understanding, Book II, chapter VIII, 21.
The measurement of heat
A thermometer is, literally, a 'heat-measurer'. By convention, the term 'thermometer' is now reserved for any device which measures the amount by which heat causes a solid, liquid or gas to expand. The 'pyrometer' invented by Pieter van Musschenbroek is thus classified now as a thermometer. It uses the expansion of metals to detect exceedingly small changes in temperature, with a resolution of about 1 / 12500 of a French inch, or about 0.0002 millimeter. Émilie du Châtelet, comparing this 'pyrometer' with prior art, showed how the improved precision of instruments helps the scientist to make new discoveries. In a remarkable display of insight she suggested that all matter contains heat, and that in her future, instruments having a still greater precision would lead to new discoveries about heat. She also experimented with light from insects, long before Professor Langley.
Langley's aviation experiments
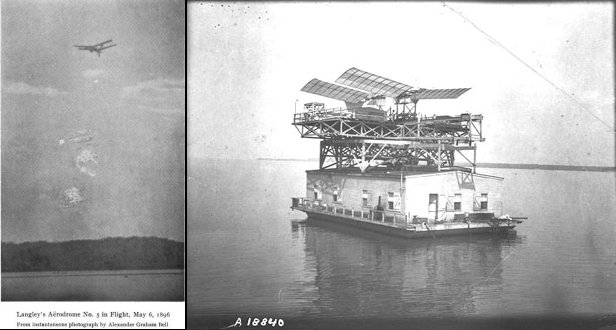
Samuel Pierpoint Langley is most widely know for his attempts to produce a piloted heavier-than-air craft. The image above shows, left, his successful model and right, his unsuccessful full-size machine. It may well be that onlookers, seeing his aerodrome dive from the houseboat straight into the water, advised Langley not to give up the day job. In fact, Langley had a night job: he was an astronomer. Dabbling with aviation was more of a hobby.
Thomas Alva Edison is not commonly known for his work on astronomy. However, in 1878 he developed a device for the remote sensing of temperature, which he called a tasimeter, from the Greek word for 'tension': tasis. The tasimeter looked remarkably like Edison's carbon microphone.
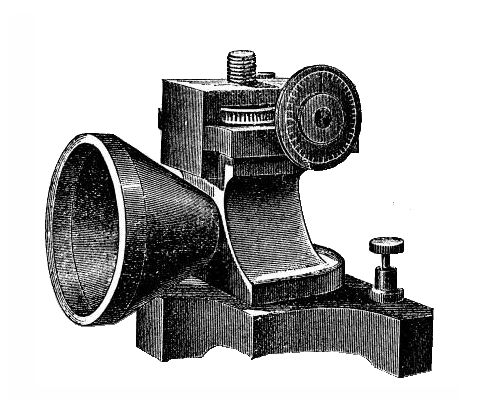
Edison's tasimeter
It is unsurprising that the tasimeter looks like a carbon microphone: it is in fact based on the same principles. However, instead of the carbon being agitated by sound, the carbon in the tasimeter is disturbed by heat: that is to say that the electrical resistance of the tasimeter varies in some proportion to the heat falling onto its sensor area.
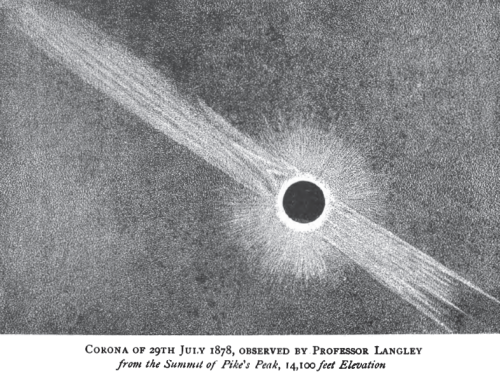
Langley was fully expecting to be supplied with Edison's tasimeter so that he could measure the temperature of the solar corona during the then forthcoming total eclipse of July 29, 1878. Not only did Edison not supply Langley with the tasimeter, but Edison went with a team and his tasimeter to Pike's Peak. To the annoyance of many professional astronomers, the newspapers reported that Edison had gone to study the eclipse with a team of astronomers, making it appear that the astronomers were working under Edison. It is still - 2011 - being reported by some writers that Edison took a team of astronomers to see that eclipse. The truth can only flourish where error has been plucked out by the roots.
(Read more here: americanscientist.org.)
Now, Edison boasted about how sensitive his tasimeter was, demonstrating that the device could detect the heat of a person's hand at 30 feet. But one might say that Langley eclipsed Edison by inventing the much more sensitive bolometer. With the bolometer he detected previously unknown regions of the solar spectrum by aiming his bolometer at an insect: Pyrophorus noctilucens ! (For details, please read the appended chapter of the Annals.)
By means of the bolometer, Langley made many advances in infra-red spectroscopy. I have appended chapter 1 of the Annals of the Astrophysical Observatory of the Smithsonian Institution, 1900, written by Langley. In the space of just that one chapter can be found many of Langley's contributions to the sciences of astronomy, spectroscopy and meteorology.
Most particularly, Langley was the first to demonstrate experimentally the absorption of solar heat by soil, plants etc. on Earth and its re-radiation at longer wave-lengths. He also measured what is now called the greenhouse gas effect: by measuring the heat re-radiated by the moon. Langley's experiments on the 'greenhouse effect' were cited by Svante Arrhenius in his now famous 1895 paper on the effects of atmospheric CO2.
Conclusion
Edison used a modified telephone to look at the Sun's corona. Langley used his bolometer to look at the Moon. But there is another connection between the telephone and the Moon. Edison's connection with the development of the telegraph is widely known. But Langley also has a connection with the telegraph: he was responsible for setting up a time signal service which allowed American railroads to synchronize their clocks to the new railroad standard time. The revenues from that source paid Langley's salary.
Finally, to do justice to the memory of Edison: although not the discoverer of electrical induction, he was the first person to transmit a telegraph signal without wires using that principle. It was only a few inches, to Marconi's thousands of miles, but it was a definite first. Not only that, but it was a 'mobile radio'. Edison's induction system was installed in 1887 on the Lehigh Valley railroad.
Appendix
I append here a plain text transcription of Langley's Annals of the Astrophysical Observatory of the Smithsonian Institution, 1900. The original images from which I transcribed the text, and the entire book, is available on line at: http://ads.harvard.edu/books/saoann/toc.html
My purpose in making available the plain text of non-copyright scientific papers is to enable researchers to find key phrases in web searches and to cite the actual words used, rather than - as so many writers do - merely mention the existence of the paper.
My few comments are in square brackets - [ ]. Please note that figure 1 is 'soot and whitewash' in the original web page. I could not find a suitable alternative image.
The transcript begins below this page break >>>
....................................................................................
ANNALS
OF THE
ASTROPHYSICAL OBSERVATORY
OF
SMITHSONIAN INSTITUTION
VOLUME I.
By S. P. LANGLEY, Director,
Aided by C. G. ABBOT
C
WASHINGTON:
Government Printing Office.
1900
................................................................................
PREFACE.
_________
This book is the result of a research originally due to a discovery made in the year 1881 with the then newly invented bolometer, in the clear air of an altitude of over 12,000 feet, of solar heat in a then unknown spectral region, now called the "lower infra-red spectrum." The bolometer has since been used to explore and to map the region in question, through the long succeeding interval, in the latter part of which it has reached an accuracy and a sensitiveness greater than I could once have hoped for.
This map is now (June 18, 1900), after years of constant work, finally published in the present form; not because this edition is final, but because the long labor must come to some term, and because I desire to see its results published while I may hope to see them made useful.
In my early work I was led to notice not only the change of the infra-red absorption spectrum at different hours of the day, but at different seasons of the year, without my observations in the last respect having attained a precision which seemed to justify me in publishing them. Of late, improvements on the early methods seem to be at last bringing more conclusive evidence that there are distinguishable effects in the different seasons of the year upon the absorption of the solar heat by the earth's atmosphere, or perhaps it might be said, evidence that the absorption of the earth's atmosphere is directly associated with the seasonal changes of spring, summer, autumn, and winter.
While we are far from looking forward to foretelling by such means the remoter changes of weather which affect the harvests, or to results of such importance as the power of such a prevision would indicate, still it is hardly too much to say that we appear to begin to move in that direction, and it seems to me that my own early hopes of making the study of the solar energy not simply an interesting scientific pursuit, but one of material usefulness, may one day be justified.
S.P. Langley
June 19, 1900.
................................................................................
SUMMARY OF THE WORK.
_________________________
There are here presented tables and charts of the invisible infra-red solar spectrum extending to 5.3 µ and mapping nearly 750 lines, of which most are below l.l µ and are nearly all new.
There has been determined in the case of each line the relative absorption of solar energy which has produced it, while its place has been fixed from the comparison of a large number of independent bolometric observations with a probable error in prismatic deviation of less than one second of arc, and for most of the lines with a probable error in wave-length of less than 5 Angstrom units.
The infra-red region is shown to be the seat of the principal telluric absorptions of the solar energy, and a discrimination of these absorptions into those which are relatively accidental and those which are found to be annual or peculiar to each season is indicated.
................................................................................
ANNALS OF THE ASTROPHYSICAL OBSERVATORY OF THE SMITHSONIAN INSTITUTION.
___________________________
INTRODUCTION.
FOUNDATION AND EARLY ANNALS OF
THE ASTROPHYSICAL OBSERVATORY.
In the reports of the Secretary of the Smithsonian Institution for the years ending June 30, 1888 and 1889, mention is made of the hope then cherished of erecting and equipping an observatory for astrophysical research; and in the year following 1890, he is at last "able to say that this object has assumed definite shape in the construction of a temporary shed," "begun on November 20, l889 and . . . completed about the 1st of March, 1890. This building is of the most inexpensive character, and is simply intended to protect the instruments temporarily, though it is also arranged so that certain preliminary work can be done here. Its position, however, immediately south of the main Smithsonian building, is not well suited to refined physical investigations, on account of its proximity to city streets and its lack of seclusion."
This "temporary shed" still continues to be the main observatory building. It has been slightly modified within, from time to time, to make it more suitable for the uses to which it has been put, and in 1898 the southeastern corner received some enlargement to make a more commodious office. Two smaller buildings have been erected north of the original one. The first, dating from 1893, is a single room without basement, which serves for photographic purposes, and the second, erected in 1898 and provided with a double- walled basement of brick and a single story above of wood, is used for such physical researches as are crowded out of the old building by the bolographic apparatus and accessories, which fully occupy it.
Means for the original construction and for making some preliminary observations (consisting for the most part of determinations of the constants of apparatus) were furnished from the Smithsonian funds, but it was believed that the investigations to be undertaken at the observatory were of such a nature that it would be proper for the General Government to appropriate a small sum annually for its maintenance. This view has been accepted by Congress, and the first such appropriation became available in July, 18911.
________________________________________________
1 Sundry civil appropriation act approved March 5, 1891 "For maintenance of Asltrophysical Observatory under the direction of the Smithsonian Institution," etc.
................................................................................
2
In bringing the matter to the attention of Congress statements of the purposes of the observatory were made by the writer, which have been summarized by him in the report of the Secretary of the Smithsonian Institution for the year ending June 30, 1892, as follows:
The general object of astronomy, the oldest of the sciences, was, until a very late period, to study the places and motions of the heavenly bodies, with little special reference to the wants of man in his daily life, other than in the application of the study to the purposes of navigation.
Within the past generation, and almost coincidentally with the discovery of the spectroscope, a new branch of astronomy has arisen, which is sometimes called astrophysics, and whose purpose is distinctly different from that of finding the places of the stars or the moon or the sun, which is the principal end in view at such an observatory as that, for instance, at Greenwich.
The distinct object of astrophysics is, in the case of the sun, for example, not to mark its exact place in the sky, but to find out how it affects the earth and the wants of man on it; how its heat is distributed, and how it in fact affects not only the seasons and the farmers crops, but the whole system of living things on the earth, for it has lately been proven that in a physical sense it, and almost it alone, literally first creates and then modifies them in almost every possible way.
We have, however, arrived at a knowledge that it does so, without yet knowing in most cases how it does so, and we are sure of the great importance of this last acquisition, while still largely in ignorance how to obtain it. We are, for example, sure that the latter knowledge would form, among other things, a scientific basis for meteorology and enable us to predict the years of good or bad harvests, so far as these depend on natural causes independent of man, and yet we are still very far from being able to make such a prediction, and we can not do so till we have learned more by such studies as those in question.
Knowledge of the nature of the certain but still imperfectly understood dependence of terrestrial events on solar causes is, then, of the greatest practical consequence, and it is with these large aims ultimate utility in view, as well as for the abstract interest of scientific investigation, that the Government is asked to recognize such researches as of national importance; for it is to such a knowledge of causes with such practical consequences that this class of investigation aims and tends.
Astrophysics by no means confines its investigation to the sun, though that is the most important subject of its study and one which has been undertaken by nearly every leading government of the civilized world but the United States. France has a great observatory at Meudon, and Germany one at an equal scale at Potsdam, while England, and other countries have also, at the national expense, maintained for many years institutions for the prosecution of astrophysical science.
The researches of the observatory have from its foundation been under the general direction of the present Secretary of the Smithsonian Institution and the work to be described - that of studying the infra-red spectrum - was begun by him before his connection with the Institution while he was Director of the Allegheny Observatory, and its results were described in contributions to various scientific journals.
It was his intention to personally continue it here, and he has at all times endeavored, within the measure of his ability, to do so; but of late years the administration of the general interests of the Institution has so far occupied his attention that the direction of the details of the operations of the observatory, has been increasingly intrusted to other hands.
There have been associated with the writer as his immediate assistants in the work: Dr. William Hallock, Senior Assistant ; Mr. F. L.O. Wadsworth, Senior Assistant: Mr. R C. Child, Aid Acting in Charge, and Mr. C. G. Abbot at present Aid Acting in Charge, who took charge in January, 1896, and with him Mr. F. E. Fowle, still acting as Junior Assistant.
................................................................................
3
The following is a. brief account of the early annals of the Astrophysical Observatory. In recent years its history has been so far wrapped up in its principal investigation, relative to the infra-red spectrum of the sun, that it necessarily must be told in connection with the account of that research, which will be found beginning with Chapter III. Even the buildings have been altered, and in case of the later construction designed especially to facilitate bolographic research, so that they can best be described as portions of the apparatus appertaining to special research.
The main building of the observatory, illustrated in Plates I, III, IV, and V, was begun November 20, 1889, and completed about March 1, 1890. Its cost was defrayed from funds of the Smithsonian Institution.
The Grubb siderostat, Grunow spectro-bolometer, White galvanometer, and Elliott special resistance box for bolometric purposes were all procured at the cost of the Institution, and installed during the year 1890.
Before the entire completion of the building a research, which may properly be called the first to be connected with the Astrophysical Observatory, was conducted.1 The purpose of this investigation was a comparison of the light and dark radiations of the luminous tropical insect Pyrophorus noctilucus Linn., with those of similar kind emitted from the sun and artificial sources of light. Specimens of this tropical insect were procured through the Bureau of Exchanges of the Smithsonian Institution, and were examined with photometric and bolometric apparatus, partly at Washington and partly at Allegheny observatory, where a portion of the work was transferred owing to the then incomplete installation of apparatus at the Smithsonian observatory.
It was shown that the solar spectrum, when reduced to the same total luminous intensity, appeared to the eye to extend notably further both toward the red and toward the violet than did the spectrum of the insect. The visible spectrum of the latter was practically confined between wave lengths 0.45µ and 0.65µ. Bolometric experiments gave slight but unquestionable indications of radiation from the insect; but by interposing a sheet of glass opaque to wave lengths greater than 3.0µ it was found that these indications then ceased, so that they were due rather to general animal heat than to any rays associated with the luminosity. Other sources of light when reduced to equal total luminosity, including the solar beam, the Bunsen and Argand burners, and the electric light, were all found to expend incomparably more energy in invisible radiations than Pyrophorus noctilucus.
Thus nature produces this cheapest form of light at but an insignificant fraction of the cost of the electric light or the most economic light which has yet been devised.
In June, 1891, Dr. William Hallock came to the observatory as senior assistant, and preliminary work in trying and adjusting apparatus was taken up.
The first appropriation by Congress of $10,000 became available, as has been said, July 1, 1891.
_________________________________________
"The cheapest form of light," by S.P. Langley and F. W. Very, Am, Jour. Sci . third series, Vol. XL, p. 97, 1890.
................................................................................
4
March 2, 1892, the bolographic research of mapping the infra-red solar spectrum was begun.
In April, 1892, the position of the siderostat pier of the observatory was determined by the United States Coast and Geodetic Survey as follows:
Latitude 33° 53' 17.3" N.
Longitude 77° 01' 33.6" W. of Greenwich.
In the fall of 1892 a dark room was erected closely adjoining the main building, bolographic work being then well started.
A small number of instrument maker's tools, including a lathe and small planer, were procured in the latter part of 1892, and temporarily used in a shed adjoining the Smithsonian building. Two years later they were removed to a room in the Smithsonian stable, and from time to time the number has been added to, so that of recent years most of the instrument making for the observatory has been done at this shop, where one instrument maker is constantly employed.
Automatic control of the heating supply was introduced in 1896, as experience showed that only by securing a constant temperature could satisfactory bolographic work be done.
Cooling by ammonia gas was introduced in 1897, and this cooling system was also provided with automatic temperature control.
A laboratory consisting of one story and basement was erected in the latter part of the year 1898, so that at present the observatory has three buildings—the spectro-bolometric building, the photographic room, and the new laboratory.
Further details of an historical and descriptive character will be found in connection with the several researches to be described, for, as already said, the bolographic investigations have been of such a nature as to almost wholly shape the development of the observatory.
................................................................................
5
PART I.
_________
THE ABSORPTION LINES IN THE INFRA-RED SPECTRUM
OF THE SUN.
______________
Of the solar radiations which reach the earth's surface about three-fourths are invisible While the visible portion of the spectrum has been explored since the days of Newton and mapped with great minuteness, the great and important invisible portion lying beyond the red has remained comparatively unexplored and unknown. The object of the main investigation here published is to give for the first time the principal details of this region.
................................................................................
6
Chapter I.
________
HISTORICAL ACCOUNT OF CONTRIBUTORY RESEARCHES.
It will be proper to briefly refer to some of the more important of the earlier and contemporary researches which are introductory to those shortly to be described, and to mention somewhat particularly the writer's previous bolometric work of which the present in a continuation.
These references will be restricted chiefly to investigations on the distribution of heat in the spectrum, the absorption of the atmosphere, and on the infra-red line spectra of the sun and of the elements.
EARLY INVESTIGATIONS.
Sir William Herschel observed in 18001 that a thermometer exposed in the solar spectrum continued to exhibit heating effects beyond the limit of visible radiations, and he concluded that at least one-half of the heat of the spectrum was obscure. Though he found those dark rays both refracted by glass and reflected according to the ordinary law, yet he was led to the belief that heat and light exist as separate constituents of the solar radiations.
Leslie, in 1804, using a differential thermometer, found that different substances possessed quite unequal powers both for radiating and for absorbing heat. He found that nonluminous radiations were greatly absorbed by glass, which strengthened the mistaken belief that heat and light were distinct in essence.
The idea that light, heat, and actinism were entities was opposed in 1843 by Melloni, who regarded light as "merely a series of calorific indications sensible to organs of sight, and vice versa the radiations of obscure heat are veritable invisible radiations of light." This was the foresight of a man of genius, but this truth was almost universally rejected when first uttered, and it has won its way slowly to its present acceptance. The researches of Melloni and of Seebeck also showed that the disposition of the heat in the prismatic spectrum from any source depends on the substance of the prism employed, and that this is in part due to the absorption exerted by the substance.
___________________________________
1 W. Herschel, Philosophical Transactions, vol. 90, p. 394, 1800.
................................................................................
page 7 is blank
................................................................................
8
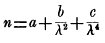
Melloni in the very word "thermochrose," which he invented, indicated that there were differences in the quality of heat assimilable to those in the color of light, but it was only in 18401 that Sir John Herschel published a thermograph which first showed unequal absorption below the red, and which is given in fig. 1.
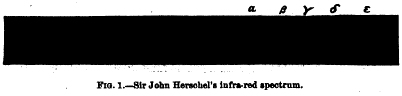
Fig. 1.—Sir John Herschel's Infra-red spectrum.
The reader may be here reminded that the observations which had preceded, and for a long time those which followed this, were made only by the prism, which gives entirely different divisions of the spectrum, according to the substance of which it is composed, and that there was no means then known of referring these to the wave-length scale, except a formula
due to the eminent mathematician, Cauchy, which was accepted for fifty years as representing a natural law, but whose values of the wave-lengths the writer has since shown to be utterly wrong and misleading, outside of the visible spectrum.
This may better explain how it was that Dr. J. W, Draper, who observed, in 1842, by phosphorescence, three wide bands, which were called by him Alpha, Beta, Gamma, was entirely deceived as to their position, so much so that, with the ignorance of the truth prevailing at even so late a period, he seems to have supposed these bands, which are almost at the beginning of the infra-red, to have marked its extreme limit, beyond which no radiation could exist.[2]
Foucault and Fizeau, in 1846, appear to have observed the same bands.
Dr. J. Muller,3 in 1859, gives a construction by means of which a prismatic spectrum may be transformed into a normal spectrum. He conjectures that the extreme infra-red is at a wave-length of about 1.8µ. In his diagram two-thirds of the heat of the spectrum appears below the visible portion.
Tyndall,4 in 1866, assigned the position of maximum heat energy to the infra-red, and estimated two-thirds the total solar energy to be distributed in this invisible region.
The publication of Lamansky5 in 1871 may be considered to represent the extent of the knowledge of this region then attained. Lamansky used the thermopile to map out the energy in the solar prismatic spectrum, and exhibits a plot, here reproduced
__________________________________
1 J. Herschel, Philosophical Transactions, vol. 130, p. 1, 1840.
2 Speaking of Abney's researches, Dr. Draper remarks, in 1880: ''Do we not encounter the objection that this wave-length (1.07) is altogether beyond the theoretical limit of the prismatic spectrum?"
3 J. Muller, London, Edinburgh, and Dublin Philosophical Magazine, fourth series, vol, 17, p. 233, 1859.
4 J. Tyndall, Philosophical Transactions, vol. 156, p. 1, 1866.
5 M. S. Lamansky, Monatsberchte der Koniglichen Akademie der Wissenschaften zu Berlin, December, 1871. Translation in London, Edinburgh, and Dublin Philosophical Magazine, fourth series vol, 43, p, 282, 1872.
................................................................................
9
(fig. 2), which shows three great gaps in the infra-red radiations. He concurs in the belief (then common) that the infra-red rays are strongly absorbed by the atmosphere.
E. Becquerel, who in 18421, had noticed the effect of the infra-red radiations upon phosphorescent matter previously exposed to the light so improved his apparatus from 1873 to 18762 that he was able to map out a considerable portion of the solar spectrum, determining his wave-lengths, however, by extrapolation from Cauchy's dispersion formula, whose indications the writer has since shown to be here untrustworthy.
In 18832 H. Becquerel much improved this method, and, using a carbon bisulphide prism and Rutherford grating, roughly mapped out the solar spectrum up to about 14,000 Angstrom units, noting the variation of the great absorption bands under varying atmospheric conditions.
He also showed that the various phosphorescent substances behave differently in
the infra-red, showing absorption bands of their own, as to which care must be taken lest they be mistaken for spectrum bands.
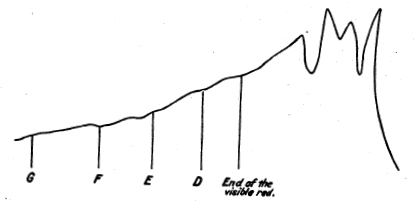
Fig. 2. - Lamansky's curve.
By means of a bromide of silver plate, specially prepared by an elaborate process, Captain Abney, prior to 18804, succeeded in photographing the solar spectrum to a wave-length of 10,000 Angstrom units. Later, with a Rowland concave grating5, he photographed the solar spectrum and published a table of absorption lines in the extreme red and infra-red, giving 429 from A down to a wave-length of about 10,000 Angstrom units. These he regarded as accurate to one-tenth of an Angstrom unit.
In 18816 J. Draper improved Becquerel's method in that he obtained a permanent record by placing a sensitive bromide of silver plate on the fluorescent screen. Lommel. in 18907, improved the method further, and published a good spectral chart
___________________________________________
1 E. Becquerel, Annales de Chimie et de Physique, third series, vol, 9, p. 314, 1843. See also vol. 22, p. 344, 1848.
2 E. Becquerel, Academie des Sciences, Comptes rendus, vol. 69, p. 995, 1869; vol. 77, p. 302, 1878; vol. 83, p. 249, 1876. Annales de Chimie et de Physique, fifth series, vol. 10, p. 5, 1877.
3 H. Becquerel, Annales de Chimie et de Physique, fifth series, vol. 30, p. 5, 1883.
4 W. Abney, Philosophical Transactions, vol 171, p. 653, 1880.
5 W. Abney, Philosophical Transactions, vol 177, p. 457, 1886.
6 J. Draper, London, Edinburgh, and Dublin Philosophical Magazine, fifth series, vol. 11, p. 157, 1881.
7 E. Lommel, Annalen der Physik und Chimie, neue Folge, vol. 40, p. 681, 1890.
................................................................................
10
made in this manner. He proposed to utilize the process in obtaining photographs
of the metallic spectra.
In 18831 E. Pringsheim, using a Crooke's radiometer, studied the distribution of energy in the solar spectrum.
THE WRITER'S EARLY WORK AT ALLEGHENY.
All of the earlier investigators who attempted to measure the relative heat in different parts of the spectrum found themselves unable to obtain results at all commensurate with the labor involved, because the heat of the spectrum was in detail wholly inaccessible to the measuring instruments at their command. It is true that progress was made by supplanting the thermometer by the thermopile, yet only those who have patiently used this instrument in its old form, as the writer has done for many years, can testify how unsatisfactory it was. The immediate need for the acquisition of a more sensitive instrument was felt increasingly by him till, upon attempting to measure the distribution of heat in the diffraction spectrum, a series of painstaking experiments satisfied him that if such a spectrum were ever satisfactorily analyzed by heat-indicating apparatus, something which should be an advance over the thermopile, as the latter had been over the thermometer, must be devised. The thermopile is limited in its action to the current directly generated by a difference of potential, which can never exceed a small and definitely limited amount, and its use in delicate research demands unlimited patience. The writer sought to devise an instrument of (theoretically) unlimited capacity which should act to control the current from an unlimited source of potential, and be at once more sensitive than the thermopile, and be both more exact as a measure, and more exact in pointing, i. e.; in work of precision.
After considerable experiment the bolometer was produced, as described at some length at the time2, and its behavior, as compared with the thermopile, was from the first exemplary. Since then there has elapsed nearly twenty years, and this instrument has so recommended itself to physicists as now to be used in many forms and for various purposes at research laboratories everywhere.
The principle upon which it is based finds more and more increasing use as a means of heat indication, so that, notwithstanding the extraordinary sensitiveness
which has of late been obtained by physical chemists from special mercury thermometers, the Wheatstone's bridge encroaches even in this field. At the same time, however, the principle which is the basis of the thermopile is much used in pyrometry, and has, through the ingenuity of Boys, furnished us the highly sensitive radiomicrometer, and still more recently the thermopile itself has been greatly improved by Rubens, so that the Wheatstone's bridge method does not hold the
___________________________________________________________
1 E. Pringsheim, Annalen der Physik und Chemie, neue Folge, vol. 18, p. 32, 1883.
2 S. P. Langley, Proceeding of the American Academy of Arts and Sciences, vol. 16, p. 342,1881.
................................................................................
11
electrical heat-measuring field alone. The bolometer is, however, so well adapted to
use in the spectrum, not alone because of its sensitiveness, but, as has just been observed, also because of its linear form and capacity for being pointed with precision, that it is doubtful if it will be easily displaced.
The first important use to which the bolometer was put was in determining the distribution of energy in the solar heat spectrum, which had hitherto been studied in detail only in that of a prism. In a memoir entitled "Observations du spectre solaire,"1 not only the prismatic but the normal energy curves were given, extending to a wave-length of 2.8.µ. It was shown that the maximum ordinate of the glass prismatic energy curve was at about 1.0 µ, while that of the normal energy curve was in the orange. Nearly three-fourths of the solar energy reaching the earth was found to be of longer wave-length than that at the A line, but the observations showed that the loss in passing through the atmosphere was chiefly confined to the shorter wave-lengths, so that it appeared that an analysis of the solar radiations conducted above the atmosphere might conceivably show a maximum in the violet of the normal spectrum.
This paper was followed in 1883 by "The selective absorption of solar energy,"2 which describes bolometric measurements made directly upon the grating spectrum and extending from the violet through the visible spectrum and [down] to a wave-length of 1 µ.
The bolometric indications observed at five different points in the normal spectrum under conditions identical except for the air mass, were compared in order that it might be quantitatively determined what the absorption of the atmosphere was for nearly homogeneous rays of different wave-lengths. These measurements confirmed the earlier conclusion that the maximum ordinate of the normal energy curve was in the orange, and showed that the absorption of the earth's atmosphere increased rapidly with decreasing wave-lengths, then a novel statement, for strange as it may now appear, it was even at this late time very generally supposed to increase most in the lower red, though the simple aspect of a sunset might have taught the contrary. Thus it appeared probable, from the present writer's conclusion, that the sun would seem bluish to an eye outside our atmosphere, and of a lavender tint could it be seen without either solar or terrestrial absorption intervening.3 A reduction of the measurements taken indicated a value of the solar constant as high as 2.84 calorics, which was much higher than any previous determination.
Another portion of the investigation may be regarded as the forerunner of the research since undertaken at Washington. This consisted in mapping the infra-red solar prismatic spectrum by means of the bolometer, as far as a wave-length of 2.8 µ
________________________________________
1 S. P. Langley Academie des Sciences, Comptes rendus, vol.95, p. 482, 1882.
2 S. P. Langley, American Journal of Science, vol. 25, p. 169, 1883.
3 See "Nature," May 26, 1887.
................................................................................
12
For this purpose an instrument called the spectrobolometer was devised, which was essentially a great spectrometer with minimum deviation attachment and arms arranged specially for the reception of the bolometer and collimating apparatus.
Four observers were employed frequently in the measurements. One set the circle carrying the bolometer successively on adjacent parts of the spectrum and read it, a second read the galvanometer deflections upon the scale, a third recorded the observations, and a fourth kept the siderostat beam from wandering and called out the appearance of clouds before the sun. The difficulties of the research lay less with the use of the bolometer than with the galvanometer as then constructed, and especially in. the tendency of the needle to wander, causing the light spot on the scale to drift with a continuous progress to the north or south when no action on the bolometer took place. This wandering of the needle, here called the "drift," then averaged much more than a centimeter in a minute, and was not only the great obstacle to accuracy, but a great consumer of time. In making the spectrum map it was customary to go over 15' of spectrum several times daily, making observations for each separate minute of arc, by opening and closing the slit at each observation, as, if it were left open continuously while the bolometer strip was carried through the spectrum, the movements of the needle caused by spectral heat were confounded with those caused by the "drift" The galvanometer reader had the most trying observations, as the "drift" was sometimes so great that the spot of light did not remain upon the meter-long scale even a minute at a time. It was recognized that the "drift" was largely due to changes of temperature in the apartment, and devices for controlling this were made, but the radical change necessary, that of installing both galvanometer and bolometer in a special apartment within a larger one, itself automatically kept at nearly constant temperature, could not be carried out for want of means.
Under these circumstances more than a thousand readings were required in this part of the investigation to fix the position of a single line, and the work of reducing and plotting the observations was enormous. The result obtained, after some two years of this labor, was to establish nearly twenty deflections in the energy curve (corresponding to absorption lines), some of them indicating regions of almost complete absorption of energy, and showing that the character of the infra-red spectrum was far different from the visual part. The curve illustrating these results is reproduced in fig. 3.
In a research subsidiary to this, entitled "Experimental determination of wavelengths in the invisible spectrum"1 the deviation and wave-length curve for the glass prism used was experimentally determined. The sun was employed as a source of heat, and the succession of apparatus was (1) condensing mirror, (2) slit, (3) concave grating, (4) slit, (5) collimating lens, (6) prism, (7) objective lens, (8) bolometer.
The results of this research showed that neither Cauchy's formula (then universally trusted) nor any other dispersion formula then extant would apply even approxi-
_________________________________________________________
1 S. P. Langley, Memoirs of the National Academy of Sciences, vol. 2, p. 149,1883.
................................................................................
13
mately in the infra-red when its constants were determined for points in the visible spectrum. It is interesting to note in this connection that Dr. J. W, Draper, in 18801, asks, in speaking of Captain Abney's researches, "Do we not encounter the objection that this wave-length, 1.07µ (the limit of Captain Abney's map), is altogether beyond the theoretical limit of the prismatic spectrum?"
The research on the selective absorption of solar energy had shown it to be desirable to make observations upon a high elevation, where the air should be both
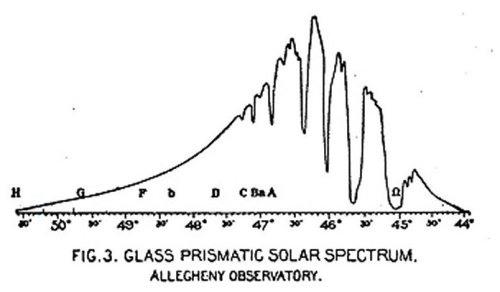
Fig. 3 GLASS PRISMATIC SOLAR SPECTRUM.
ALLEGHENY OBSERVATORY.
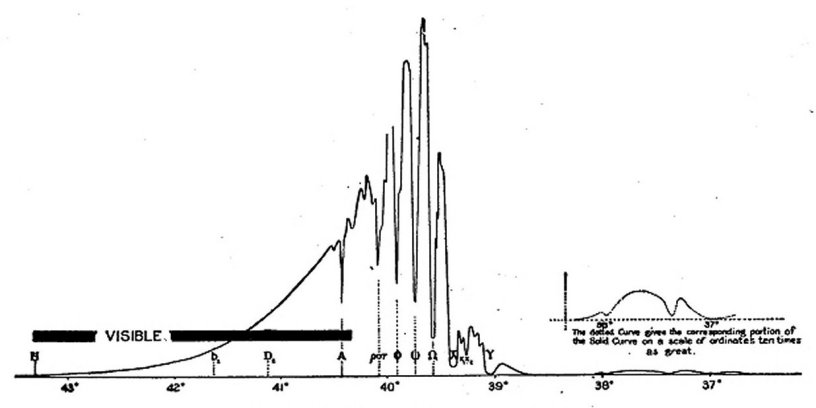
Fig. 4 ROCK-SALT PRISMATIC SOLAR SPECTRUM.
ALLEGHENY OBSERVATORY.
purer and rarer than at Allegheny. Through private and public aid an expedition was enabled to proceed to Mount Whitney2 in southern California, in 1883, where a great number of observations with actinometers of various forms and a considerable number with the bolometer and with other instruments were made. The bolometric observations were naturally conducted under great difficulties, as the character of the
______________________________________________________
1 J. Draper, Proceedings of the American Academy of Arts and Sciences, vol. 16, p. 233,1880.
2 "Researches on Solar Heat. A report of the Mount Whitney Expedition." U.S.A, War Department, Professional Papers of the Signal Service, No. 15,1884.
................................................................................
14
instruments employed demands the utmost stability and most careful installation rather
than transportation across a continent and through a wilderness with temporary arrangements of a few weeks' duration.
It was in the course of these observations, and on this mountain, at an altitude of 12,000 feet, that the writer, after carrying the bolometer to the end of the then known prismatic spectrum (near what is now known as Ω), was rewarded for all past pains by first discerning beyond this "end" a new region of almost indefinite extent, in which physicists have subsequently found a fertile field.
This first discovery of the new region was made in this pure air of Mount Whitney at an elevation of 12,000 feet with a glass lens. In subsequent determinations no energy of consequence could at. first be detected below the band called X at wavelength about 2.8 µ, even with the rock-salt train, so much more transparent than glass to rays of great wave-length.
The observations showed the higher air to be more transparent than the lower, but the earlier results on the progressively increasing transparency for longer wave-lengths were confirmed. This result was reconciled with the fact that the earth is warmed sensibly and kept at its present temperature by the rays of the sun, by remembering that the heat reradiated by-the earth's surface into space is apparently of longer wave-lengths than any received from the sun and may presumably be to a great extent cut off by special absorbents, as the experiments show that in the infrared great absorption bands become increasingly in evidence, but in spite of these absorption bands, the principal portion of infra-red solar energy is transmitted more freely than the visible.
A value of the solar constant much greater than that of previous experimenters was obtained with fair agreement between several independent methods in which the bolometer had an important part. This value indicates that outside the earth's atmosphere the solar rays, falling vertically, would raise one gram of water at least three degrees centigrade in one minute for each square centimeter of exposed surface, or, in other terms, that a coating of ice around the planet 54.5 meters thick would be melted by the solar heat in each year.
Rock salt had been shown by Melloni to be invaluable for researches in the lower infra-red despite the temporary character of its surfaces by reason of its great transparency to the heat rays of this little known region. Glass, on the other hand, of the thickness needed, was found almost opaque for wavelengths greater than 2.8 µ. By the aid of a rock-salt prismatic train the knowledge of long wave-length radiations was extended to include those radiations sent out from terrestrial sources.
In the paper describing these experiments, entitled "Invisible heat spectra, and the recognition of hitherto unmeasured wave-lengths,"1 it is remarked that for the first
_______________________________________________________________
1 S. P. Langley, Proceedings of the American Association for the Advancement of Science, vol. 34, p. 55,1886.
................................................................................
15
time prisms of rock salt having good definition had been constructed. The source of heat employed in the research was a blackened Leslie tube filled with some liquid of known temperature. In front of the tube was an ice screen with a suitable central aperture, and a second ice screen was employed as a shutter before the slit. Two rock-salt lenses of 3.5 meters focus were used for collimator and objective, and the 60° prism was of rock salt 64 mm. on a side. The bolometer strip, 2 mm. wide, subtended 20' and the slit the same.
A test of the selective absorption of rock salt for the rays in question was made by inserting a polished flat nearly a centimeter thick in the beam after each deflection, but it was found that allowing for the loss by reflection no appreciable change in absorption could be observed.
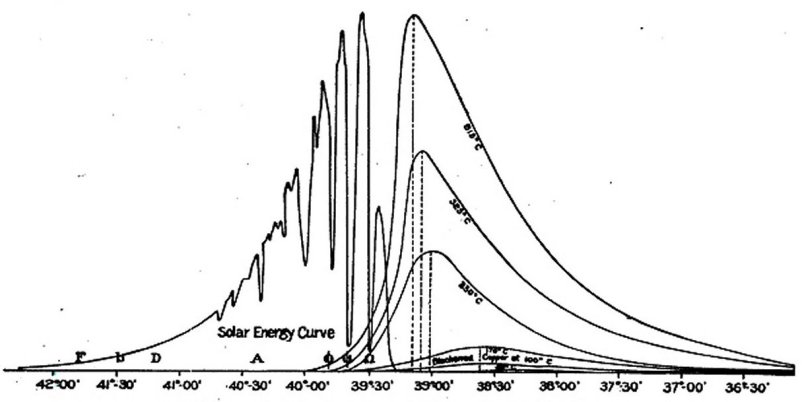
FIG. 5. -ROCK-SALT PRISMATIC SPECTRA.
ALLEGHENY OBSERVATORY.
The result of the investigation was to show that the heat from terrestrial sources, such as heated soil, is of a much longer wave-length than the major portion of that received from the sun, and that rising temperature in the source of heat shifted the maximum ordinate of the energy curve toward the, shorter wave-lengths. The greater portion of the energy was in all energy curves found to be of wave-lengths greater than that of the maximum intensity. A reproduction of these curves is given in fig. 5. An appendix gives a table of deviations observed for the principal visible Fraunhofer lines and for a number of lines in the infra-red, as determined from the spectrum of the rock-salt prism. This table was accompanied by a convenient correction1 determined for the reduction of observed deviations to the proper value for a prism of slightly different angle.
________________________________________
1 Due to Professor Keeler.
................................................................................
16
In a following memoir upon "Hitherto unrecognized wave-lengths,"1 reference is made to a former investigation in which the infra-red wave-lengths were determined as far as 2.3 µ, but the research was there discontinued on account of the too feeble energy received from the grating. The determinations of the wave-lengths of the rock-salt prismatic spectrum was now continued to open the field for further researches in solar and terrestrial radiation, by enabling one to husband the available energy by the use of a prism, and still to know the wave-lengths employed; for it will be remembered that even as late as this time the lengths of most of these invisible waves were not known by experiment, but inferred by calculation from almost wholly untrustworthy formulae.
The sun could not here be used as a source of energy, for though it had been shown that some of its radiation of wave-lengths greater than 2.3 µ is received at the earth, yet this portion was quite too slight to use for this purpose with the means then at command. In the place of the sun was therefore substituted an electric arc, which was caused to play between carbons 1 inch in diameter by the current of a 12-horsepower dynamo. Even with this source the deflections obtained were so small that the measurements could not be extended beyond 5.3 µ, but this was then far beyond where any real measurement had yet been made. The method was to observe a ray or rays which had been both reflected from a grating and refracted by a prism, and to thus observe what wave-length corresponded to a given index of refraction. As the importance of the result may justify a fuller description of the means, it may be added that the train of apparatus commenced with the arc light mounted immediately before the slit. After considering many devices it was determined to let the rays fall first on a grating and then upon the prism. The rays from this first slit fell then upon a (Rowland) concave grating, which, by the nature of the interference process, necessarily formed them into superposed spectra, lines whose wave-lengths were multiples of one another, lying upon one another, and becoming confused together. Since these lines are of different wave-lengths, however, they are of different refrangibility, and if they are caused to pass through a prism this will separate them. A second slit was interposed where the grating spectra were formed, and through this slit, as appears from what has been said, only radiations having a multiple of some determined wave-length could pass. For the purposes of the experiment the wave-length of D2=0.5890µ was chosen. These radiations and their multiples alone passed through the second slit and, diverging, fell upon a rock-salt prism. Out of different possible positions of the prism, that was chosen where the refracting edge was parallel to the lines of the grating, and the prism thus placed refracted the radiations at different angles in azimuth, giving distinct images of them. The linear bolometer was
___________________________________
1 S. P. Langley, American Journal of Science, vol. 32, p. 83, 1886.
................................................................................
17
moved until it encountered one of these feeble heat images — that due, for instance, to the ray whose wave-length was twice D2, whose indications were recognized when the bolometer was in a position corresponding to a certain index of refraction of the prism. The bolometer was then moved until it encountered the second heat image, belonging to the next higher order of spectra, and, so on through nine in succession, when the wavelength of 5.3µ (nine times that of D2) was reached. Beyond it the heat was too feeble to be recognized, and in this way the wave-lengths corresponding to refraction in a prism were first definitely measured in this lower infra-red region.
The galvanometer employed was of the four-coil Thomson reflecting type. Its needle system (constructed by Mr. F. W. Very) was composed of hollow steel magnets 1 mm. in diameter, 8 mm. long, and with walls 1/20 mm. thick. The mirror, 9.5 mm. in diameter, of platinized glass, was of 1 meter radius. Damping was secured by the use of a portion of a dragon-fly wing, a device of the writer, then first used. Suspension was made by means of a silk fiber 33 cm. long, and the time of swing of the needle without damping magnet was from fifteen to thirty seconds.
A cylindrical scale was employed, and the position of the spot could be read to
1/10 mm.
The sensitiveness of the galvanometer was at that date stated to be such that, with a time of. single vibration of twenty seconds, a deflection of 1 mm. on the scale at 1 meter is given by a current of 5 x 10⁻¹⁰ amperes through the coils, which were each of 20 ohms resistance; but the observation of small deflections was rendered very difficult by the drift.1 Bolometers were then used in connection with this instrument, such that a deflection of 1. mm. corresponded to 1/100000 degree differential change of temperature of the strips.
It is mentioned that in using the salt prism fourteen months it was necessary to refigure its surface and redetermine its angle thirteen times.
The results obtained (which are given in the appendix to this volume) show the refractive indices of rock salt for wave-lengths extending from λ = 0.4µ to λ = 5.3 µ.
On comparison with existing formulae for dispersion none were found which adequately represented the observations. The latter part of the curve showing the relation of n to λ was found to approach a straight line (without becoming one), and an extrapolation was essayed beyond the point where the observations stopped, though it was remarked that all such extrapolations are attended with uncertainty, a remark too soon justified. By this means it was shown that if the curve continued to approach a
_________________________________________________
1 If we admit that the deflection is inversely as the square of the time of swing, this gives for a ten-second single vibration a millimeter deflection for a current of 2 x 10[superscript unreadable]. That at present (1899) is (for ten-second swing) 5 x 10-12 showing a sensitiveness four hundred times as great. With the present galvanometer the needle is so very light (2.5 mgr.) that the tremor becomes too prejudicial with a ten-second swing, and being thus restricted to a five-second or shorter swing, not more than fifty times the sensitiveness of the Allegheny instrument (which could be employed with a twenty-second swing) is actually available, but the saving of time is also of great importance.
................................................................................
18
straight line, as appeared probable, the maximum of the spectrum of melting ice would be at a wave-length of at least 10µ, and that the lowest heat recognized thus far would have a wave-length of something like 30 µ.
It must be here remarked that the later observations of other physicists, while they agree well with the observed values determined up to 5.3µ, yet make the results of extrapolation probably so far erroneous, that while the progress of the curve from 5.3µ still, perhaps, requires further investigation, it seems certain that the values of wave-lengths obtained in the above-mentioned extrapolation are too high. The latest values are those obtained by Paschen and Rubens, and some account of their researches will be found in the appendix. In Plate XXXII, illustrating this work, the values of the writer, of Paschen, and of Rubens, have been plotted and a representative curve has been drawn to show the mean result of the three determinations.
In a memoir upon "The solar and lunar spectrum,"1 which appeared in 1886, the solar spectrum was followed far below previous investigations. The arrangement of apparatus in this research is chiefly distinguished by employing two complete spectroscopes, with rock-salt collimating lenses and prisms, of which the first was called the "sifting train," and was used in order to guard the more effectually against stray radiations from the upper spectrum, which would introduce important errors where so little energy existed. Using the extrapolation already discussed, it was found that from a little beyond the absorption band, known as Y, until a wave-length of 10µ is reached no energy could be observed, and beyond this the amount was but trifling. In an appendix-there is given a table of deviations observed in the rock-salt spectrum. Following this, the bolometer was used in a research on the "Temperature of the moon,"2 which does not in the main have a direct bearing on the present one, but in which some points of interest appear. It is mentioned, in describing the apparatus, that a battery of 15 gravity cells was employed in the bolometer circuit to diminish the irregularities in the current. This multiplication of the number of cells is due to Mr. Very, and has been found very useful in subsequent practice. In Appendix III of this paper is given a reduction of observations made from time to time during the course of two years to determine the change of deviation of a 60° rock-salt prism with the temperature. It is remarked that the then only available way to estimate the temperature of the prism was by observations of the temperature of the air, which could not have failed to be a fruitful source of discrepancy in the results. The table of values obtained is reprinted on a subsequent page of the present memoir.
________________________________________________________
1 S. P. Langley, Memoirs of the National Academy of Sciences, vol. 4, p. 159,1886.
2 S. P. Langley and F. W. Very, Memoirs of the National Academy of Sciences, vol.4, p. 107, 1887.
................................................................................
19
RECENT INVESTIGATIONS OF INFRA-RED SPECTRA
BY OTHERS THAN THE WRITER.
Closing here the summary of infra-red researches at Allegheny, we will now turn
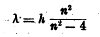
to a consideration of the more recent determinations of the origin of some of the infra-red metallic lines. One of the interesting- phases of this portion of the infra-red investigation is the finding of lines already predicted from the lines now known in the visual and ultraviolet portions of the spectrum. Balmer2 showed that the wave-lengths of a certain series of lines in the hydrogen spectrum could be represented with surprising accuracy by the empirical formula—
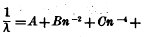
n representing the successive ordinal numbers above 2 and h a constant. Later, Kayser and Runge[3] showed that in the spectra of nearly all the elements there are series of lines whose positions may be expressed by empirical formulae of the form
where λ = the wave-length, and thus 1/λ is a number proportional to the frequency of oscillation, and n represents the successive ordinal numbers. They also found that in cases where series of pairs occur the difference of the values of 1/λ between the members of any one of the pairs is a constant for that element and series.
In 18924 B. F. Snow, in order to test Kayser and Runge's formula, investigated the infra-red spectra of the alkalies. He used a flint-glass prism, calibrated by means of interference bands, and a bolometer capable of indicating a difference of temperature of 1/130000oC. He determined the position of his interference bands to a wave-length of 26,680 Angstrom, units. His spectra were obtained from the salts of the metals inserted as a core in the carbons of an arc lamp.
________________________________________________
1 For an account of dispertion and wave-length investigations with rock salt; see Appendix, as well as Chapter I of Part II.
2 J. Balmer, Annalen der Physik und Chemie, neue Folge, vol. 25, p, 80,1885.
3 H. Kayser and C. Runge, Abbaudlungen der Koniglichen Academie der Wissenschaften zu Berlin, III, 1888-I892.
4 B. F. Snow, Annalen der Physic und Chemie, neue Folge, vol. 47, p. 208,1892,
................................................................................
20
The following table contains the lines observed by Snow in the infra-red, in which λ represents the wave-length in thousandths of a millimeter (µ), and I the relative intensities of energy as indicated by the galvanometer deflections:
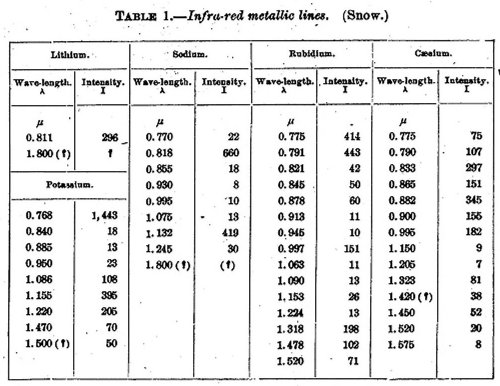
TABLE 1.—Infra-red metallic lines. (Snow.)
The lines which had been predicted were for-
Lithium 0.819µ
Sodium 1.150 1.148µ
Potassium 1,266 1.257 1.253µ 1.244µ
Rubidium 1.718 1.653
Caesium 0.922 0.877 0.867 0.828
In the case of lithium and sodium the agreement with the empirical formula seems to be fair, but with the others Snow thinks no conclusion can be drawn.
In 18951 E. P. Lewis undertook the determination of the infra-red metallic spectra. He used a radiomicrometer in connection with a Rowland grating. The grating was ruled with 10,000 lines to the inch, and was of 14 feet focus. He used it as in Rowland's well-known method. Its first spectrum was unusually bright and was visible beyond the usual limit in the infra-red. He employed an arc light with its carbons prepared in the same manner as those used by Snow.
The following table gives a summary of the lines found by Lewis, together with a comparison of the intensities of the lines, the D lines being taken as 60.
_________________________________________________
1 E. P. Lewis, Astrophysical Journal, vol. 2, pp. 1 and 106,1893.
................................................................................
21
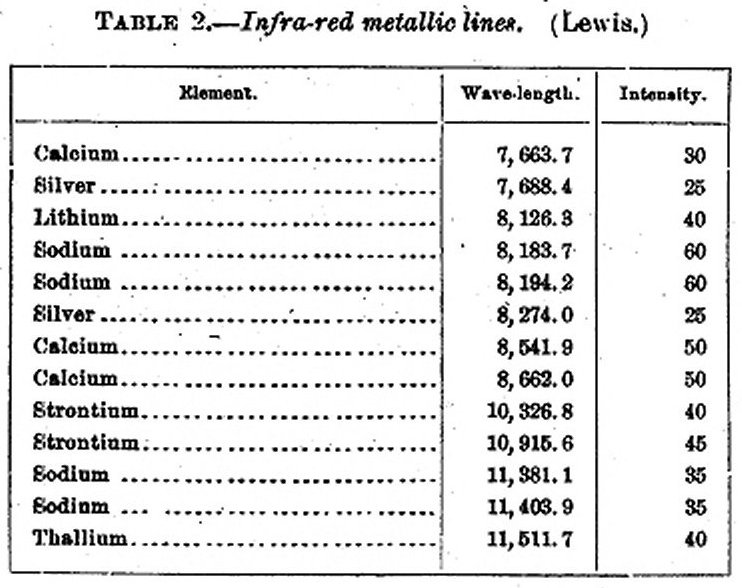
TABLE 2.— Infra-red metallic lines. (Lewis.)
The following lines, predicted by Kayser and Runge, were not found:
Mercury 9497
Magnesiurn 13007 13041 13111
Calcium 11801 11874 12020
Strontium 13022 13345 14086
In closing this extremely succinct account of researches bearing upon the present investigation, the writer may mention that researches of his own on the diathermancy of lampblack and hard rubber have showed lampblack nearly (not wholly) without color here. Reference should also be made to an article of E. F. Nichols1, treating of the diathermancy of plate glass, hard rubber, quartz, lampblack, cobalt glass, alcohol, and various solutions. The result of chief interest in the present research is that lampblack absorbs nonselectively throughout the region studied (to 3µ)
In connection with those studies of selective absorption the writer calls attention to his own observations made in 1881 on the coefficients of reflection from two surfaces of silver.2 The following table embodies these observations.
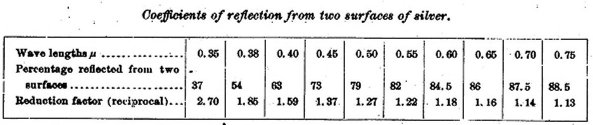
Coefficients of reflection from two surfaces of silver.
_________________________________________________
1 E. F. Nichols, Physical Review, vol. 1, p. 1, 1893.
2 S. P, Langley, American Journal of Science, Vol XXXVI, Nov., 1888, p. 9.
................................................................................
[End of transcription]


Comments