

Advances in science frequently generate new words and phrases. Accordingly, a good source of etymological information can often help pin down the era in which a new discovery was made. Similarly, a knowledge of the history of discovery can help to pin down the era in which a word or phrase was coined.
It is frequently observed that, when something is very much in the public mind, the words and phrases associated with it become a kind of communal property: a meme. That fact about language can help the science historian or etymologist in his or her quest for knowledge. If only one could produce a bar chart of word usage over the years, one could discover when a term was coined. Not only that: one could observe cycles of popular knowledge about the associated science or technology.
A Hansard search bar graph
A Handy Bar Graph Generator
No scientist would normally look to politics in order to discover scientific truths. However, politicians tend to gorge on memes and zeitgeists even more than most ordinary people do. Now, if you could only plot memes against time you could see at a glance how a meme takes hold and then it either stays popular or it fades away. Such a tool would not only be useful for science historians and etymologists: it would help us to understand politicians, and we need all the help we can get with that one.
Hansard is the record of proceedings in both Houses of Parliament. A very extensive Hansard database has been made freely available on-line for researchers. Although the search engine is rather fuzzy it is very useful. Results are returned as a bar graph and as yellow highlights. A link with no highlight will usually be a false positive, as in the image below.

A false positive for "event horizon" March 1 1944
The search engine, as I mentioned, is fuzzy. This means that a search for "atom" will return results including many related words such as "atomic". The Hansard search result here is very interesting to the science historian.
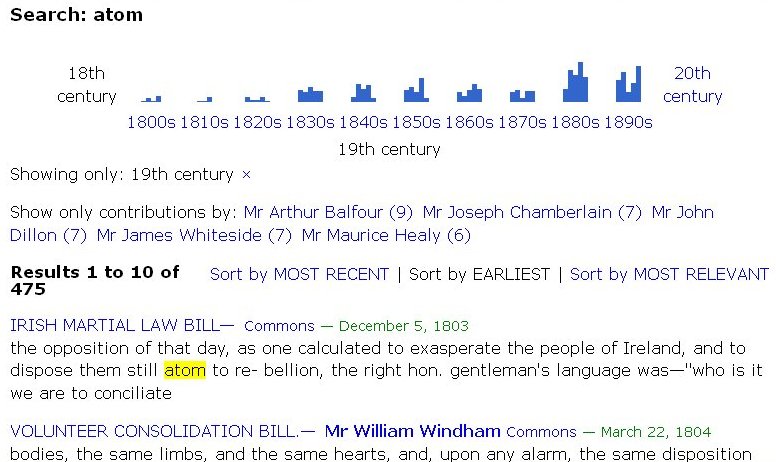
The first result is a false positive due to a typo. The second result is very interesting: Dalton laid out his atomic theory in 1803 in his On the Absorption of Gases by Water and Other Liquids. Here we see a politician already using the term metaphorically in 1804. He refers to a reorganized body of men having:
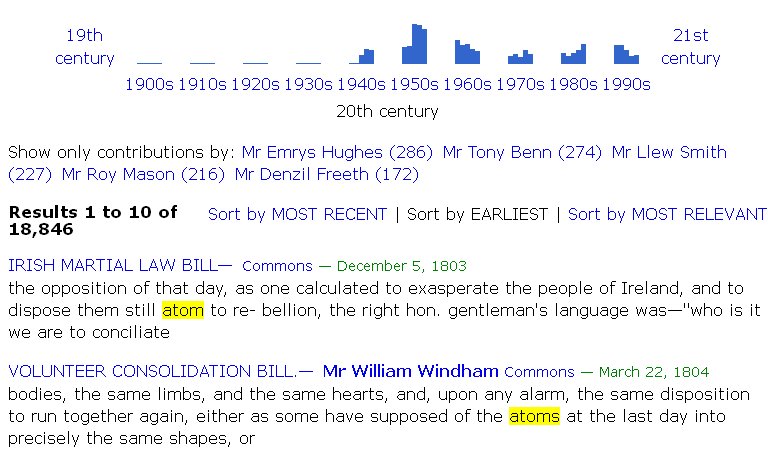
the same hearts, and, upon any alarm, the same disposition to run together again, either as some have supposed of the atoms at the last day into precisely the same shapes, or into new combinations possibly not less advantageous.The bar graph for the 1800s shows a rise in the use of the term 'atom'. Strangely we see - in the image below - a flat-lining in the 1900s until the dawn of the atomic age.
The etymologist and science historian can find much that is of interest using just this one tool. Here are two aviation-themed bar graphs, with links to the actual search results.
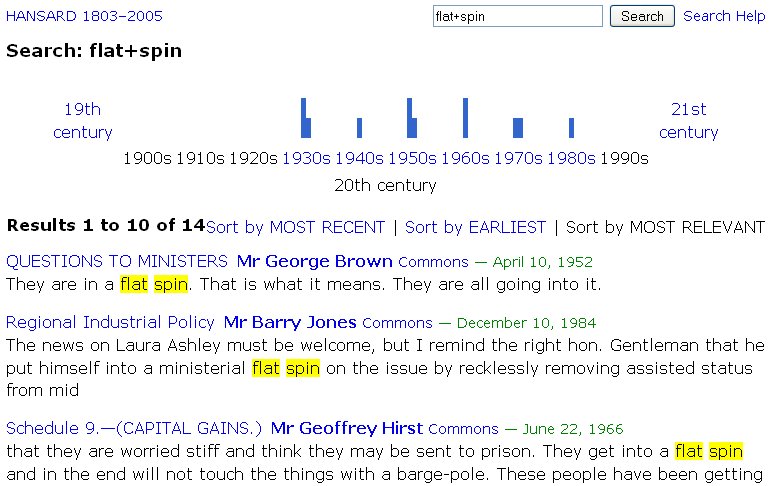
Flat spin
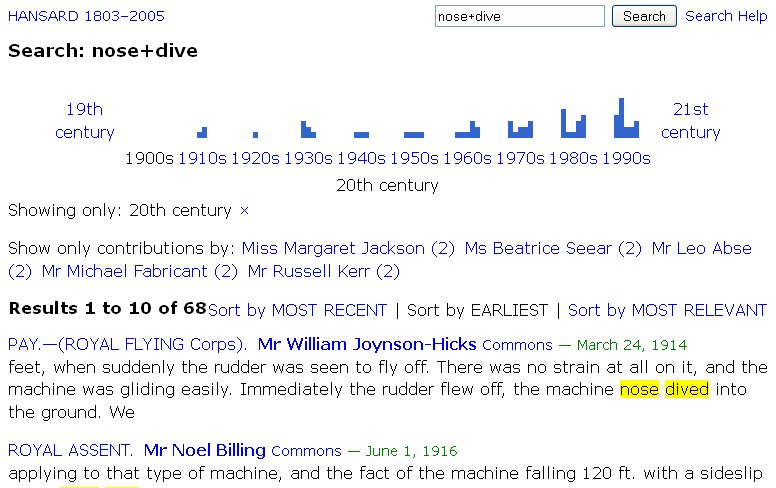
Nose dive
Just for fun, or maybe psychological research, you can discover something about UFOs and flying saucers.
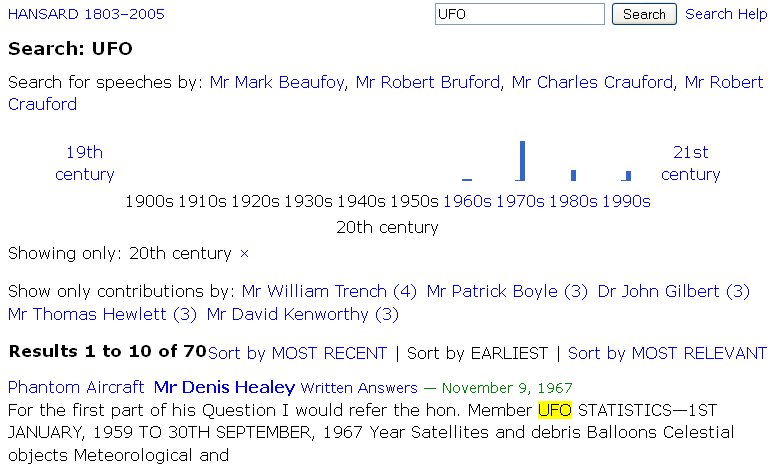
UFO
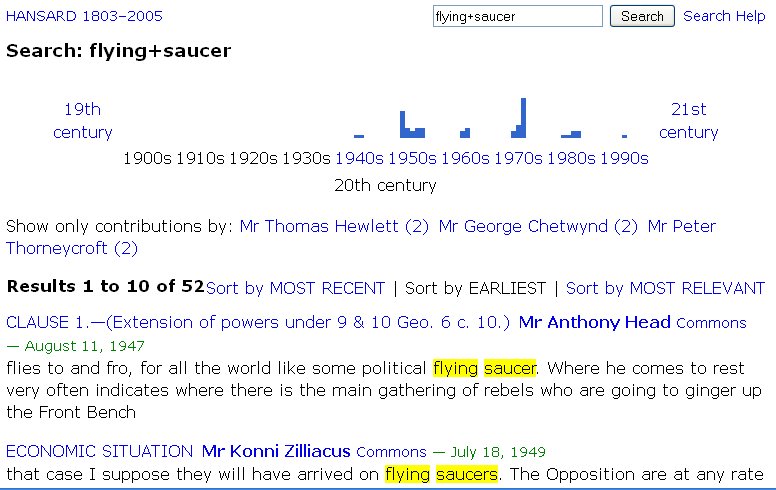
Flying saucer
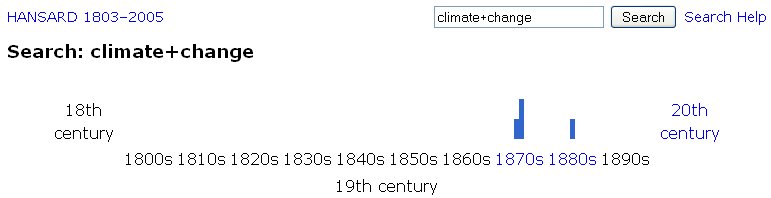
The very first image on this page shows a bar graph for "climate change". Here is a fuller image with the link. Taken with a search result for "global warming" it is a very good piece of rebuttal evidence against the folks who say things like: "They used to call it global warming, now they call it climate change."
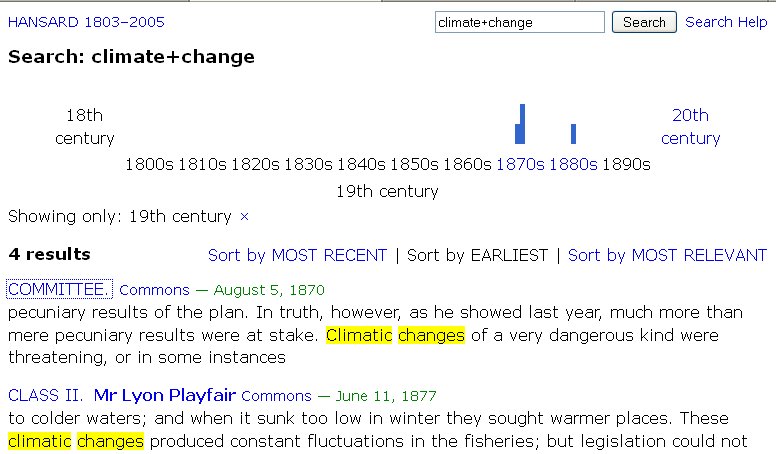
Climate change
Note in the above search results that Lyon Playfair was a scientist speaking on climate science.
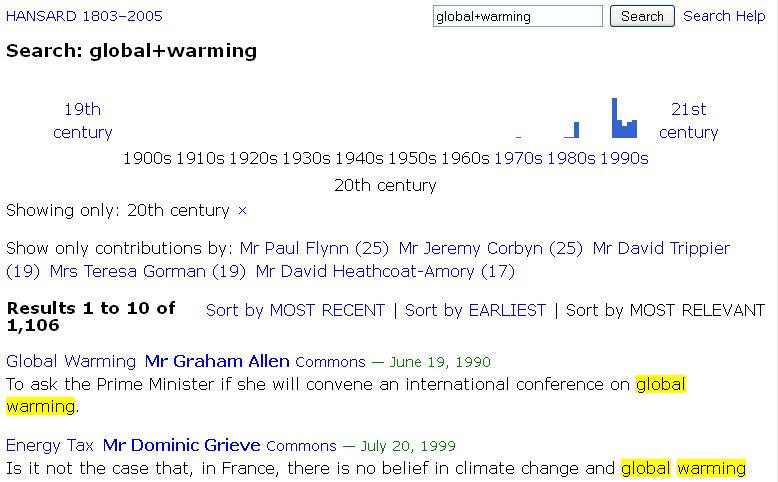
Global warming
I leave it to my readers to search for terms such as 'carbonic acid', carbon dioxide' and CO2. Who knows, you may find this research tool as useful as I do.


Comments