


Currently working on a paper about fishes, I came across some interesting figures. (Well, mildly interesting, as they are more of the same actually). Let me say, first of all, that much of what we have learned about genome size evolution is thanks to the work of Ralph Hinegardner in the 1970s. He did some of the most substantial investigations of DNA content diversity in groups such as molluscs, crustaceans, echinoderms, and fishes -- in some cases, his work remains the main source of information. So, needless to say, I have a lot of respect for his work. Second, I want to note that I think FishBase is absolutely excellent. It is a model for how online databases should be, and I use it frequently. In fact, without it the study I am writing up could not have been accomplished.
Nevertheless, I have to be fair to others whom I have picked on and point out these questionable plots:
Hinegardner and Rosen (1972):
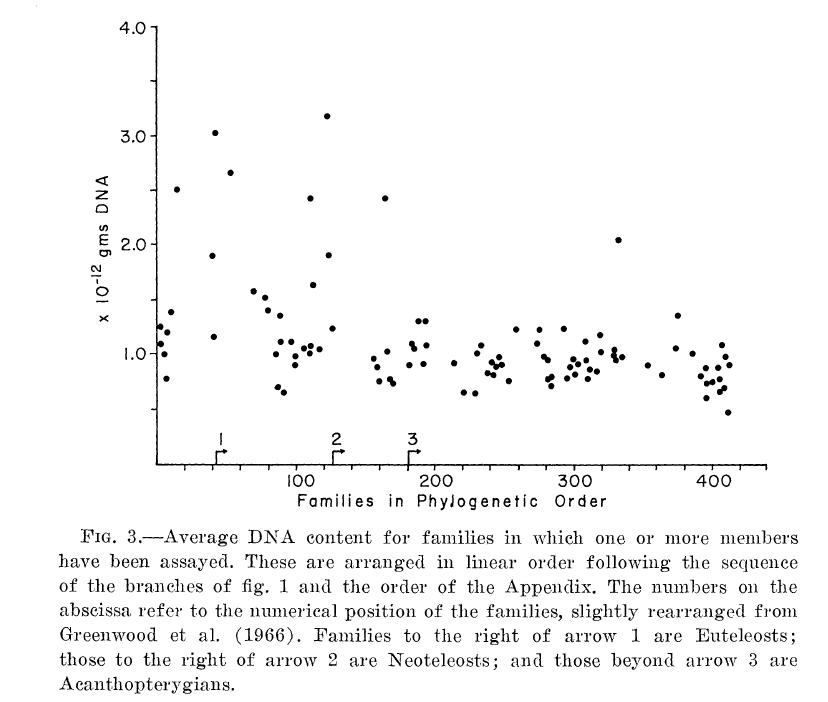
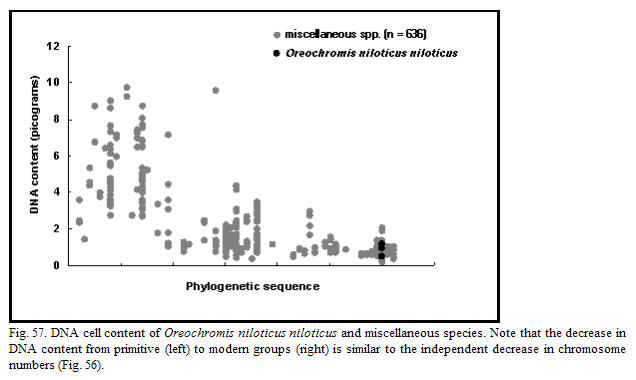
I think there is a tendency among ichthyologists to rank groups in "phylogenetic order", perhaps meaning in terms of time of first appearance (though if based only on taxonomy without fossil data this is problematic of course). However, these are all modern species, and if you trace back through time, the lineages of which they are current representatives have been evolving for exactly the same amount of time since they split from a common ancestor. It could be that genome size changes primarily during diversification events, in which case groups that have undergone less speciation over time may have smaller or larger genomes. On the other hand, suggesting that some lineages have had more time to accumulate or lose DNA makes no sense when comparing modern species. I think in this case the figures represent a holdover from Hinegardner's early ideas that "specialized" fish have less DNA, which he explained as being a result of body parts and genes being lost -- an idea that is no longer workable given what we now know about the genome. In any case, whenever I see an axis labeled "phylogenetic sequence", I think "rotate a few nodes and then plot it again!".


Comments