


There is another possible periodicity that is worth discussing briefly. In Table 1, we summarize the times and depths of 10 discrete dips present in the Kepler light curve, also labeled in panel‘(b)’ – ‘(e)’ of Figure 1. If we examine the two most prominent dips (D1568 and D1520; also see panel ‘(d)’ in Figure 1), we see that they have a separation of ∼ 48.8 days. We can also see that the D800 dip (dip #5 in Table 1) is separated from the D1520 dip by 15 of these intervals, if the interval is more precisely defined to be 48.4 days. Furthermore, the very shallow dips early in the Kepler time series at D260 and D360 are very close to 26 and 24 of these 48.4-day cycles from the D1520 dip. The other five identified discrete dips (four of which are very shallow), also listed in Table1, are about a half cycle out of phase with this period to within ∼ ±5% of a cycle. In this exercise, we have neglected the fact that the three most prominent dips in the D1500 region are quite highly structured, and they also have additional minima whose times could have been tagged and included in the analysis. At this time we do not ascribe any particular significance to this period, but it is something to bear in mind as more data on this object become available.An orbital resonance model can explain this pattern, but there's an interesting caveat: In terms of being able to observe the pattern, the angular vantage point around the orbital circumference matters. In the model I'm going to propose, there are 13 spots around the circumference where the pattern can be observed precisely. You have to be fairly close to one of these 13 angles to see it. My subjective estimate is that there's only a ~12% probability that we would be close enough to one of these privileged spots and still be able to claim to see the pattern. It's not impossible, but our vantage point is fortunate. The pattern is not just interesting. I will argue it can be helpful in determining periodicity without having to wait years to observe multiple repeats of known dips. I will further argue we not only have a pretty good idea of the orbital period of the D1540 group, but we can also determine the orbital period of the transit that produces D792.
Before I go into the details of the model and dip periodicities, let's take a look at what Boyajian et al. (2015) was describing. The following table shows intervals between the 6 biggest dips. I'm counting the group of dips between Kepler days 1519 and 1589 as a monolithic group which I call the D1540 group.
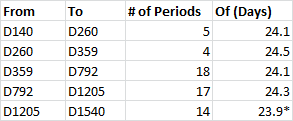
*The interval between D1205 and the average of D1519 and D1568 is 14 periods of 24.2 days.
There is also a more recent set of observations that is relevant. Dips observed in 2017 from the ground with the LCO network (see the WTF blog for the latest) have some similarities to the D1540 group, observed with Kepler in 2013.
A convincing argument can be made that the orbital period of the D1540 group is approximately 65 periods of 24.2 days, but that's an unpublished result and beyond the scope of this post. Reddit user Gary Sacco (gdsacco) is who first proposed this orbital period, prompting much justified skepticism, including from me. The main problem is that he didn't have an explanation for the significance of the number 65. Based on the orbital resonance model I will be describing, I can now say the 65 is correct and it seems to be a straightforward consequence of how the orbital resonance is configured.
Pickard's AAVSO Dip
On May 4, 2016, Roger Pickard (director of the Variable Star Section of the British Astronomical Association) observed what appeared to be a major dip in the V-band brightness of Boyajian's Star. His observations were submitted to AAVSO. The subsequent discussion on Reddit is informative.
The dip was clearly significant in a purely statistical sense. Roger Pickard said he went over the set of observations multiple times and found nothing wrong with them. An experienced observer, Pickard has made 3994 observations of KIC 8462852 alone. The apparent dip was soon forgotten and ignored, not because it was formally rejected after analysis, but because it lacked independent confirmation — until now.
Because, as I claimed, we have a reasonably good understanding of the orbital behavior of the D1540 group, the only major Kepler dip that might have been replicated by the Pickard dip is D792. Let's see how this hypothesis holds up.
The Julian Date of peak depth of Pickard's dip is ~2457512.6. D792's peak occurs at ~2455625.72. The hypothesized orbital period is therefore 1886.9 days.
An orbital period of 1886.9 days is equivalent to 77.97 periods of 24.2 days, or 78 periods of 24.19 days. Half of the orbital period, or 39 periods of 24.19 days, also works. A "coincidence" is not impossible. The observation is 0.7 days away from the nearest multiple of 24.2, and every 24.2 days there is a timestamp that matches the pattern.
But there's a second "coincidence". I already noted that the orbital period of the D1540 group is 65 periods of ~24.2 days. The ratio between 65 and 78 is better expressed as 5:6 (⨯ 13). And 5:6 is a perfectly plausible orbital resonance.
Note that we've found two distinct "coincidences". First, if two orbital periods are multiples of 24.2 days, it doesn't mean that they'll necessarily have a clean resonance ratio between them. Suppose that instead of a 78 we had found a 66 or 67. Second, if the orbital period A is a multiple of 24.2 days, and orbital period B has a clean resonance ratio with period A, it doesn't necessarily mean that B will be a multiple of 24.2 days.
Putting it all together, we have evidently confirmed that a repeat of D792 was recorded by AAVSO observer Roger Pickard on May 4, 2016.
I would like to take the opportunity to point out that Bayesian Inference works. One of its fundamental principles is that if the probability of a hypothesis, P(H), is low a priori, and an event E occurs, then the posterior probability of the hypothesis, P(H | E), can be greater (or less) than the prior probability.
I'm sure it seems strange that I'm having to explain that Bayesian Inference is a useful analysis tool, but I've recently had this argument with several different people.
There are related methodological matters that should be taken into consideration. For example, can you go and look for all unlikely hypotheses that had been missed and then accept the ones that improve after event E? In theory, you can, if you properly control for Multiple Comparisons — something researchers often neglect to do. In general, I would not recommend it because it's essentially Data Dredging.
For this AAVSO analysis I only looked at one particular dip that I knew was plausible and unresolved (perhaps the only one of its kind) and that was the end of it. That's the right approach to this type of analysis, in my view.
Now, it would make sense to go back and analyze the data to see how often we should expect that event E causes hypothesis H to be more plausible. For example, it would be worthwhile to analyze all AAVSO timestamps to determine how often they produce a period that is both a multiple of 24.2 days and has a clean resonance ratio with the orbital period of the D1540 group.
An Orbital Resonance Model
I have a script that can be used to test resonance models, and I'm making it available on GitHub.
It's possible to produce the semi-periodicity pattern with arbitrary orbital periods that are multiples of 24.2 days, but there's a major problem with this: When a transit crosses our line of sight, all other transits have a time offset that is a multiple of 24.2 days. This is possible if our line of sight happens to be at exactly the angle where transits are configured this way. If the line of sight moves, the pattern goes away. We should assume such a fortunate setup is highly unlikely.
A good orbital resonance model should therefore have the following constraints:
- It should not be nearly impossible to observe the semi-periodicity pattern under the model. This means that the greatest common divisor of the orbital periods divided by 24.2 must be a reasonably large integer. (If the greatest common divisor is 13, then there are 13 vantage points around the circumference where the semi-periodicity pattern is observable.)
- It should explain the apparent resonance between the D1540 group and D792, which is either 6:5 or 3:5.
p(n) = n * 13 * 24.2 daysThis is one model that works, at the same time that it meets the constraints I outlined. There could be other such models.
Under this model, the D1540 group has an orbital period of p(5), and D792 has an orbital period of either p(3) or p(6). Note that all orbital periods are in resonance with one another.
It's unclear which orbits would be occupied by other transits, but it seems that p(1) and p(2) would produce frequent transits that we don't see in Kepler data.
It's possible that D260 has a period of p(4). That would mean it recurred at the same time as D1519, so it would've been obscured. Similarly, the interval between D260 and D1205 is approximately equivalent to p(3).
Orbit 3 is nearly in the habitable zone for planets. Orbits 4 and 5 are in the habitable zone. Orbit 6 is just outside the habitable zone.
What to Expect
The model can be confirmed and refined with new observations. Unfortunately, observing small dips of ~0.5% might not be plausible from the ground.
With a high degree of confidence, we can say that D792 should be observed again on July 4, 2021. It's also possible its orbit is p(3), in which case we should see it on December 3, 2018. Since we don't have a way to choose between p(3) and p(6) at this time, I'd say there's a 50/50 chance we'll see D792 again in 2018.
References
Boyajian, et al. (2015). Planet Hunters X. KIC 8462852 - Where's the Flux? arXiv:1509.03622


Comments