

The CDF article is 29 pages long, but most of the stuff you are probably going to be interested in is in pages 3 to 19, where all the different searches are described in some detail, the statistical model is discussed, and the results are provided, and interpreted in the context of the standard model. I find less interesting the discussion of fermiophobic models and fourth-generation scenarios, and also scarcely informative the section where fits are performed to the "effective couplings" as evidenced by the signal strength obtained in the various production and decay modes.
With respect to the latter I agree I might sound snobish; but the reason is that, if interpreted as due to a Higgs boson, the effect observed by CDF is a barely 2-standard-deviation one, once search channels are combined. Further, no single channel by itself returns a signal more significant than that (otherwise it might have indeed been interesting). The resulting constraints one can place on the anomalous couplings of the particle to fermions and bosons are therefore quite weak and practically inconclusive.
CDF UPPER LIMITS
Here, today, rather than showing a pot-pourri of the final CDF Higgs results, which you can find in the paper anyway at your leisure, let me just discuss the combined exclusion limit: this is the by now ultra-famous graph where, as a function of the (allegedly unknown) Higgs boson mass, one draws a curve which constitutes the computed upper limit on the rate of production of the particle.
The reason why I want to discuss that figure alone will be clear below. For now, let me explain it as well as I can, so that we are on the same page. The measurement unit on the vertical axis is such that a rate of 1, at any mass value, correspond to the standard model prediction: so if the thick purple curve (describing the combined limit resulting from use of all the information from the different searches) stays above 1 it means that the experiment could exclude very high rates of particle production, but ones that are above the predictions of the standard model: these limits are thus not very informative, because they do not "fight" with the theoretical prediction.
Instead, when the limit curve sinks below the level of 1.0, the corresponding mass values are said to be "excluded" by the data, because if a Higgs boson exists, with a mass in that range, and with a production rate conforming to the standard model, then the probability to obtain the data actually observed is smaller than 5 percent. This is what happens to the CDF data for mass values in the range 90 - 102 GeV and in the range 149-172 GeV.
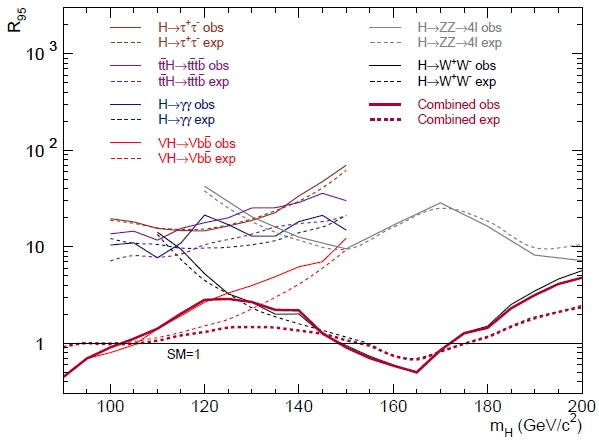
In the graph are reported the various rate limits obtained by many different searches. The Higgs boson indeed has a quite varied production and decay phenomenology, so it is possible to search for a large number of different signatures. At the Tevatron, the most important production mode is the one whereby the Higgs boson is radiated off a vector boson: this so-called "Higgs-strahlung" process allows one to flag the interesting events by the vector boson decay, and then try to reconstruct the Higgs boson mass from its decay products.
Also important at the Tevatron is the "b-bbar" final state of Higgs boson decay: for a 125 GeV Higgs boson this is the most frequent result of the decay, but it is not easy to extract it given the presence of large backgrounds, when a pair of b-quarks is produced by ordinary quantum-chromodynamical processes.
So in the graph you can see that the most testing limit curve among those reported in the low-mass region is the red one, which corresponds to Higgs-strahlung off vector bosons followed by Higgs decays into b-quark jets. The departure of the observed limit (full curve) from the expected one (dashed curve) is thought to be due to the contribution of real Higgs events in that search sample.
DID WE LIE ABOUT OUR SENSITIVITY IN 1999 ?
Okay. Now that we are familiar with the combined CDF result, let me come to the most interesting part of this article.
In the past I have entertained a couple of times in the task of answering the a bit embarassing question "Now that we know how well CDF did in the search of the Higgs, can we judge whether CDF was over-optimistic in its promises of discovery reach ?". You can find a couple of articles I wrote to answer the topic here and here, e.g.. But maybe I can quickly offer some background here in order for you to fully appreciate what is the significance of this question, and how it can be answered.
Before the start of the Run II of the Tevatron, while the experiments were busy finalizing their upgrades, a group of physicists from CDF and DZERO joined forces to try and answer the question of what could be the integrated luminosity needed to produce meaningful results in the searches for the Higgs boson. This was an important datum, based on which one could decide whether it would be worthwhile to run the machine for many years, whether experiments had to plan an upgrade of their inner silicon vertex detectors (the parts which wear out the most with accumulated data, due to the high levels of radiation near the collision points), etcetera. All these answers were useful to determine the planning of the scientific program of the Tevatron in the first decade of this century.
In order to evaluate the chances of a Higgs discovery, or to determine the sensitivity to place upper limit on the particle cross section, of course it is necessary to perform an analysis of the data. Mock data, for sure, but a real analysis! Many brilliant ideas were first tested in that study, and subsequently developed in the forthcoming decade.
The main Higgs result of the 1999 Tevatron SUSY-Higgs report is shown below (with an addition from the 2003 HSWG study which I avoid discussing today -you can ignore the broken lines at low mass). As you can see, it is cast in a similar language to that of the figure we have just finished discussing. The lower curve, in purple, reports as a function of the unknown value of the Higgs mass the integrated luminosity (on the vertical axis, in inverse femtobarns of proton-antiproton collisions at 2-TeV center-of-mass) estimated to be needed for the "rate limit" to sink below the standard model prediction (and thus exclude a particular mass value), once one added together the results of the CDF and DZERO experiments, and combined all sensitive search channels.
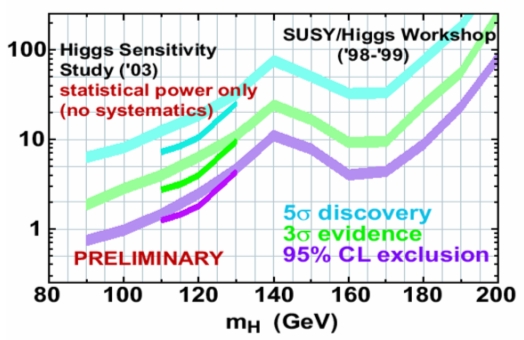
The middle curve in green instead shows the integrated luminosity required to have a 50% chance of obtaining a 3-sigma evidence for the Higgs boson, again as a function of the particle mass. The upper cyan curve, finally, extending into unimaginably high luminosity territory at high Higgs masses, shows the luminosity required for a five-sigma observation of the particle.
Now, before we compare the results shown in that graph with those actually produced by CDF, we need to point out a few "caveat emptor" notes. In 1999 we did not have a full simulation of the CDF and DZERO detectors available: the detectors had not even been put together yet! The best that could be done was to imagine an "average" detector with sensitivity of the various components similar to those expected for the two experiments. Also, there was no real measurement of background rates: one had to rely on estimates based on simulations of the relevant physical processes. And finally, theory predictions in 1999 were not exactly the same as those we have available nowadays, so there is some level of approximation involved when comparing calculations performed in 1999 with ones produced today, even having factored out all the assumptions about detector efficiencies and running conditions.
Once all the above is said, we can proceed with our exercise: what we do is to "translate" the "luminosity for 95% CL limit" curves of the Tevatron working group study into the expected value of the rate limit of CDF based on 10 inverse femtobarns of data. We do that by considering that a doubling (halving) of the integrated luminosity would result, if one just scaled the datasets size, in a sqrt(2) better (worse) upper limit in the signal rate. This is quite naive, but not too far from the truth. Also, note that in order to translate the 1999 predictions into a result to compare to the one shown by CDF, we have to consider that the former is based on adding the results of CDF and DZERO together: so the integrated luminosity has to be multiplied by two in the 1999 graph.
The result of the exercise can be cast in a "ratio" plot: one where, for every Higgs boson mass, one shows a ratio between the actual CDF result (but we take the expected limit -as reported in the paper linked at the top-, to avoid being driven by statistical fluctuations: that is the best estimate of the CDF sensitivity and it is actually the homogeneous quantity to compare to the 1999 study, since both are "median limits", i.e. they represent the median of the corresponding density function in the predicted upper limits) and the one that the 1999 result, properly extrapolated, would predict. Values higher than 1 in the ratio plot therefore denounce optimism in the 1999 study, and values below 1 show that the predictions were overconservative.
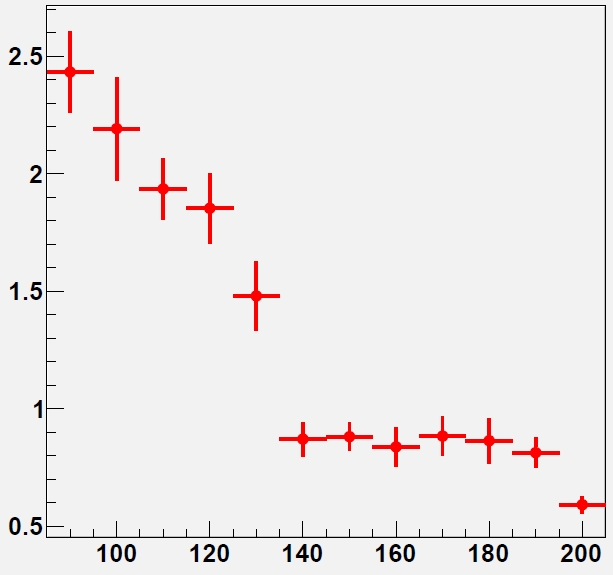
So here is the graph. As you can see, CDF did extremely well for masses of the Higgs boson above 135 GeV, where the decays which dominate the proceedings are those involving W boson pairs. Or one could say that our 1999 study was right on the money a good 15 years before!
For masses below 135 GeV, however, one notices a consistent ratio of 2-2.5, which indicates that the predictions were way too optimistic, or that the results were way sub-par. But what is the truth of the matter then ?
The truth of the matter is that the 1999 study had considered a quite optimistic, albeit still realistic, performance of the silicon detector. Reality was different: more dead channels than expected (due in part to problems with the cooling in the ISL, in part to wirebonding resonances being hit by the trigger rate frequency, causing whole columns of strips to be lost), and crucially the cancelation of an upgrade program for the whole inner silicon tracker, which would have extended the life of the detector as well as improved its performances. Also worth noting is the running conditions of the Tevatron, which ended up being different from what had been used in the extrapolations (instantaneous luminosity plays a role -degrading b-tagging efficiency among other things). All these factors could not be foreseen at the time of putting together the predictions.
The b-tagging efficiency curves considered for some of the 1999 studies are shown in Fig. 23 of the cited report. In it you notice b-tagging efficiencies reaching above 70% (for the loose tagging criteria), which in reality were never achieved.
So predictions for b-tagging were quite optimistic; but CDF was also unlucky to some extent. In addition, one must consider that the B-tagging efficiency enters all signal collection efficiency calculations for low-mass Higgs searches (where the Higgs is sought primarily in its b-bbar final state) with the second power, so an overestimate of efficiency has a doubled impact.
The other suspect for an overestimated sensitivity to H->bb decays is the dijet mass resolution: in order to "see a peak" in the dijet mass distribution one has better reconstruct the signal as precisely as possible, i.e. with the best possible mass resolution, such that all signal events will cluster at the true particle mass, standing up better on backgrounds. In the 1999 study we could rely on estimates of improvements in the dijet mass resolution which had been partly proven on the signal I myself had extracted in Run I data, that of the Z decay to b-quark pairs; however, I think the estimates for the mass resolution used in the study were not too optimistic: a 15% relative resolution was used, based on a DZERO study.
In conclusion, was the 1999 Tevatron SUSY-Higgs report overoptimistic in assessing the chances for a Higgs boson search by the CDF and DZERO experiments ? Well, I would say yes, but only partly so. I would say it was slightly overoptimistic, but also quite unlucky in its low-mass predictions; on the other hand, it proved accurate for high-mass ones. This, of course, is only my own opinion on the matter. Note that I did participate in the study, and signed the report; however, I only worked at mass resolution issues, so I do not feel particularly guilty!


Comments