

Before we start I want to be clear that I am not making predictions, nor advocating any particular solution, since that would only be speculative on my part. Instead I am simply reviewing what is supposed to be a part of modern economic theory to see what it tells us.
Let’s examine the Laffer Curve.
Sometimes the graph is drawn horizontally, but it expresses exactly the same concepts, so the relative orientation is irrelevant.
As you can see, there is a point A and a point B shown on the graph which indicates that the same revenue is available at two vastly different tax rates. In other words, the tax rate from point B can be lowered to the rate indicated at point A and the government would collect the same revenues, or this is what the graph would have you believe.
The first question to ask, is what mathematical formula gave rise to this expression. Interestingly, there isn’t one. This is simply drawn from someone’s imagination and is used to represent what economists ‘think” might happen.
It should be clear from the most cursory examination that the optimum revenue would be generated at a 50% tax rate. There’s no need for debate, since that is clearly what is indicated by the graph. Obviously things aren’t quite that simple.
Assessing the end points, at 0% tax rate, it is clear that the government would collect no revenue, so this agrees with our intuition. However at 100% the graph also shows the government collecting no revenue. This isn’t quite so intuitive, so let’s see if it’s true.
Since the tax base consists of individuals as well as businesses, a 100% tax rate would indicate that all the money earned/generated would go to the federal government. However, this represents one of the problems with the Laffer Curve. Regardless of how one interprets the concept of 100% tax rate, the reality is markedly different and isn’t explained by the model.
Since the economy consist of people (and businesses), they cannot survive on nothing, so something must be happening that is hidden from this simplistic graph. If we assume that people want to eat, and have a place to live, and all the other necessities of living (we’ll ignore luxury items), then it is clear that they must have a source of income. Similarly businesses must have a source of revenue to maintain operations.
What we actually find is that instead of 0% revenue, the government is collecting 100% of the wealth and then redistributing the income amongst the people and businesses to facilitate the requirements of the society. In other words, the government becomes an exclusive distributor of wealth and effectively subsidizes everything. This is similar to what happened in many of the communist countries, where the government determined what one was paid and what revenue was allocated to specific individuals.
While there may be other interpretations of what would happen under such circumstances, the point of interest is that at 100% taxation, the graph DOES NOT DIP DOWN. In fact, it would behave as intuition suggests, which is that of a linear graph originating at 0% until it reached 100%.
It has been argued that the reason the graph drops to 0%, is because there would be no incentive for people to work and so no income would be available to the government. However, this isn’t true, because of the need to survive, people would have the incentive to minimally cooperate with such a system to gain the necessities. Certainly personal motivation would suffer, and it wouldn’t represent a very robust or healthy way of producing goods and services, but it would function (it could be argued that this is a variation of the feudal state).
In fact, since the government would be determining the amount of money people got, there would be strong incentives for individuals to cooperate at varying levels to try and maximize what they might obtain. Once again, this closely parallels the type of behavior we saw in communist economies.
Bear in mind that my point is not to justify government taxation nor the rate at which it is levied, but rather to examine whether the Laffer Curve tells us anything useful about this phenomenon at all. At this point, we can see that it is highly suspect in terms of what it suggests.
The simple relationship between the tax rate and revenue is a linear one, which can be expressed as follows:
(Tax Rate Percentage) (Total Taxable Base $) = (Revenue $)
From this simple equation it is easy to see that if revenue is to remain constant in light of a reduction in the tax rate, then the tax base must grow to compensate for the difference.
This adds another layer of consideration around the assessment of the three major tax-cuts in recent history (1), but given the huge growth in the Gross National Product (GNP), it is plausible that the growth of industry during these periods would’ve increased revenues anyway. The reduction in taxes, would’ve helped by creating more disposable income which could have gone to increase demand and thereby drive production even higher.
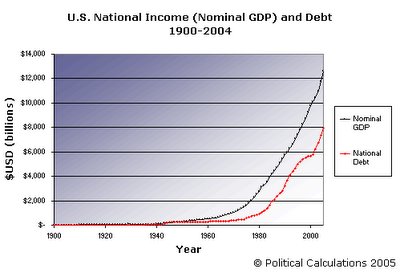
It is also important to evaluate how much the federal deficit grew during each period of tax cuts, because with the government’s ability to borrow, the connection between the tax rate, and available revenue is misleading. Often the revenue shortfall was made up by borrowing. It can be clearly seen that whatever increase in federal revenue occurred, it didn’t halt the continued level of borrowing, so any supposed benefits from tax cuts is suspect. (see graph)
Whatever the reasons, the Laffer Curve did not provide us any insight into why this happened or why it should happen. So basically what we have is a graph that creates the illusion of being mathematical, despite having no equation from which it is derived. It is endlessly quoted as a means of peddling a political agenda, and in the end, has no ability to predict events at all.
So the only conclusion that we can come to, is that there is no economic “silver bullet” that is capable of raising revenue to the federal government without ultimately taking it from the taxpayers. Anything else is “snake oil” until someone comes up with a theory that actually has predictive capability.
(1) Harding – 1920’s; Kennedy – 1960’s; Reagan – 1980’s


Comments