


The Allen Brain Atlas, a genome-wide map of the mouse brain on the Internet, has been hailed as “Google of the brain.” The atlas now has a companion or the brain’s working molecules, a sort of pop-up book of the proteins, or proteome map, that those genes express.
The protein map is “the first to apply quantitative proteomics to imaging,” said Richard D. Smith, Battelle Fellow at the Department of Energy’s Pacific Northwest National Laboratory, who led the mapping effort with Desmond Smith of UCLA’s David Geffen School of Medicine.
“Proteins are the lead actors, the most important part of the picture,” PNNL’s Smith said. “They are the molecules that do the work of the cells.”
Fine-tuning such proteome maps will enable comparisons of healthy brains with others whose protein portraits look different. Contrasts in location and abundance of proteins may display the earliest detectable stages of Alzheimer’s, Parkinson’s and other neurological diseases. They hope such diseases might be curbed if caught and treated early enough.
The National Institutes of Health-funded study, performed at DOE’s Environmental Molecular Sciences Laboratory on PNNL’s campus, is published in the advance online edition of Genome Research and featured in current Nature online Neuroscience Gateway (http://www.brainatlas.org). PNNL staff scientists Vladislav A. Petyuk, Wei-Jun Qian and UCLA’s Mark Chin are co-lead authors.
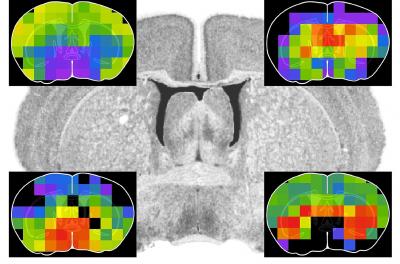
To produce the map, the team characterized center-brain slices as several dozen 1 millimeter cubes, or “voxels,” to “show us where proteins appear in the brain and where they vary in abundance,” PNNL’s Smith said. “We labeled all the proteins so we would have reference points so we know we’re looking at the same protein between different parts of the brain and from one mouse to another.”
Until now, proteomics, which enlists a specially modified instrument called a mass spectrometer for the task of identifying proteins and tallying them, has been akin to flying blind over a lake of proteins. The abundance and protein type could be discerned from a given sample, but “knowing their location and how the abundances change in different cases is important for understanding what they do,” PNNL’s Smith said.
He said that variations in genomic material across the slice, specifically messenger RNA, from the Allen Brain Atlas should be similar to the observed proteome. This turned out to be the case, which helped to validate the new measurements.
“What the Allen Brain Atlas doesn’t tell you is which genes produce proteins and how much of each of them,” he said. Marrying the voxel map with proteomics, researchers were able to generate “quantitative information on close to 1,200 different proteins.”
Note: This article has been adapted from a news release issued by DOE/Pacific Northwest National Laboratory


Comments