


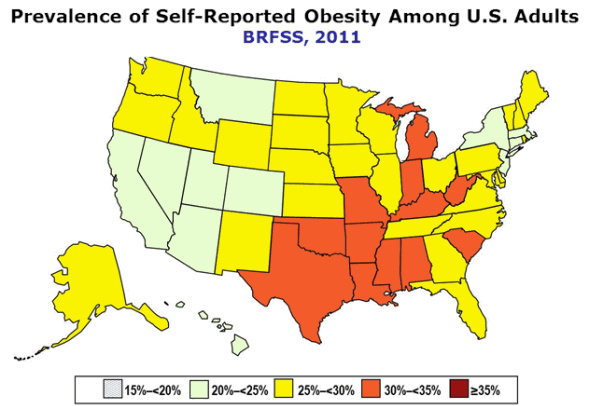
The 2011 obesity map from the Centers for Disease Control, detailing adult obesity prevalence for all U.S. states based on Behavioral Risk Factor Surveillance System (BRFSS) data, is out and it doesn't look good. Rates of adult obesity remain high, ranging from 20.7 percent in Colorado to 34.9 percent in Mississippi.
12 states (Alabama, Arkansas, Indiana, Kentucky, Louisiana, Michigan, Mississippi, Missouri, Oklahoma, South Carolina, Texas, and West Virginia) had a prevalence of 30 percent or more. The South had the highest prevalence of adult obesity (29.5 percent), followed by the Midwest (29 percent), the Northeast (25.3 percent) and the West (24.3 percent).
For 2011, there was an overall change in the BRFSS methodology, including the incorporation of cell-phone only households and a new weighting process. These changes in methodology were made to try and ensure that the sample better represents the population in each state. Second, to generate more accurate estimates of obesity prevalence, small changes were made to the criteria used to determine which respondents are included in the data analysis.
Because of the changes in methodology, estimates of obesity prevalence from 2011 forward can't be compared to estimates from previous years. Data collected in 2011 will provide a new baseline for obesity prevalence data collected in subsequent years.
BRFSS is only one of several data sets that monitor rates of obesity in the United States. When considering these other data sets, including the National Health and Nutrition Examination Survey (NHANES), the obesity epidemic is still a major public health problem.
Obesity averages tell part of the story but not the entire one. Some groups are more obese than others. Non-Hispanic blacks have the highest age-adjusted rates of obesity (49.5%) compared with Mexican Americans (40.4%), all Hispanics (39.1%) and non-Hispanic whites (34.3%) (JAMA. 2012;307(5):491-497. doi:10.1001/jama.2012.39). Socioeconomic status is also considered. Among non-Hispanic black and Mexican-American men, those with higher incomes are more likely to be obese than those with low income but higher income women are less likely to be obese than low-income women. There is no significant relationship between obesity and education among men. Among women, however, there is a trend—those with college degrees are less likely to be obese compared with less educated women.
| State | % | Confidence Interval |
|---|---|---|
| Alabama | 32.0 | (30.5, 33.5) |
| Alaska | 27.4 | (25.3, 29.7) |
| Arizona | 24.7 | (22.7, 26.9) |
| Arkansas | 30.9 | (28.8, 33.1) |
| California | 23.8 | (22.9, 24.7) |
| Colorado | 20.7 | (19.7, 21.8) |
| Connecticut | 24.5 | (23.0, 26.0) |
| Delaware | 28.8 | (26.9, 30.7) |
| District of Columbia | 23.7 | (21.9, 25.7) |
| Florida | 26.6 | (25.4, 27.9) |
| Georgia | 28.0 | (26.6, 29.4) |
| Hawaii | 21.8 | (20.4, 23.4) |
| Idaho | 27.0 | (25.3, 28.9) |
| Illinois | 27.1 | (25.4, 28.9) |
| Indiana | 30.8 | (29.5, 32.3) |
| Iowa | 29.0 | (27.6, 30.3) |
| Kansas | 29.6 | (28.7, 30.4) |
| Kentucky | 30.4 | (28.9, 31.9) |
| Louisiana | 33.4 | (32.0, 34.9) |
| Maine | 27.8 | (26.8, 28.9) |
| Maryland | 28.3 | (26.9, 29.7) |
| Massachusetts | 22.7 | (21.8, 23.7) |
| Michigan | 31.3 | (30.0, 32.6) |
| Minnesota | 25.7 | (24.6, 26.8) |
| Mississippi | 34.9 | (33.5, 36.3) |
| Missouri | 30.3 | (28.6, 32.0) |
| Montana | 24.6 | (23.3, 26.0) |
| Nebraska | 28.4 | (27.6, 29.2) |
| Nevada | 24.5 | (22.5, 26.6) |
| New Hampshire | 26.2 | (24.7, 27.7) |
| New Jersey | 23.7 | (22.7, 24.8) |
| New Mexico | 26.3 | (25.1, 27.6) |
| New York | 24.5 | (23.2, 25.9) |
| North Carolina | 29.1 | (27.7, 30.6) |
| North Dakota | 27.8 | (26.3, 29.4) |
| Ohio | 29.6 | (28.3, 31.0) |
| Oklahoma | 31.1 | (29.7, 32.5) |
| Oregon | 26.7 | (25.2, 28.3) |
| Pennsylvania | 28.6 | (27.3, 29.8) |
| Rhode Island | 25.4 | (23.9, 27.0) |
| South Carolina | 30.8 | (29.6, 32.1) |
| South Dakota | 28.1 | (26.3, 30.1) |
| Tennessee | 29.2 | (26.8, 31.7) |
| Texas | 30.4 | (29.1, 31.8) |
| Utah | 24.4 | (23.4, 25.5) |
| Vermont | 25.4 | (24.1, 26.8) |
| Virginia | 29.2 | (27.5, 30.9) |
| Washington | 26.5 | (25.3, 27.7) |
| West Virginia | 32.4 | (30.9, 34.0) |
| Wisconsin | 27.7 | (25.8, 29.7) |
| Wyoming | 25.0 | (23.5, 26.6) |


Comments