
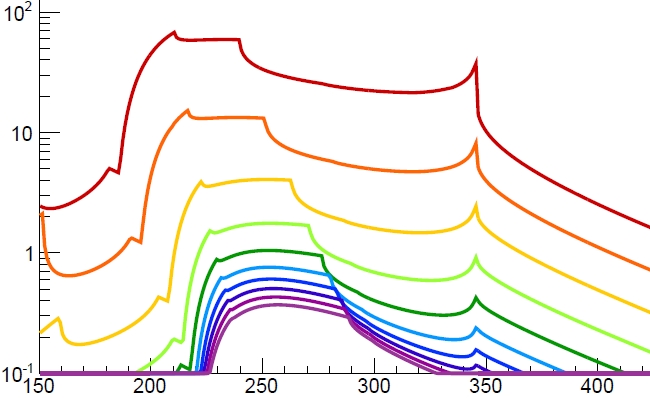
Of course it is virtually impossible to answer all the above without being given some hint. I can tell you it has to do with LHC searches, and that is all the help I am going to give you!

Please donate so science experts can write
for the public.
At Science 2.0, scientists are the journalists,
with no political bias or editorial control. We
can't do it alone so please make a difference.
We are a nonprofit science journalism
group operating under Section 501(c)(3)
of the Internal Revenue Code that's
educated over 300 million people.
You can help with a tax-deductible
donation today and 100 percent of your
gift will go toward our programs,
no salaries or offices.


Comments