

That decay mode is the highest-probability one - about four out of five Higgs bosons will prefer to yield b-quarks when they disintegrate - but its observation is complicated by the fact that backgrounds are very large: pairs of b-quark jets are very, very common in high-energy proton-proton collisions. However, CMS has just produced results of a search which reaches enough sensitivity to that final state to allow us to be quite confident that the H->bb decay mode is there, at the expected rate.
As you will see below, we are talking about a two-sigmaish effect; why then would one claim that is the case ? Is it not five sigma the "observation-level" significance enabling physicists to put forth such claims ? Well, while it is true that a two-sigma effect could be due to anything, there is nothing wrong in attributing it to the most probable source. And in this case I am sure most of you would agree that the most likely source of a 2-sigma excess of H->bb-like events in CMS data is, well, H->bb events in CMS data.
So let us look at this evidence in more detail. The events are collected to agree with the "boson Higgsstrahlung" topology, whereby a Higgs boson is emitted by a off-shell W or Z boson, with a final state including both particles: WH, or ZH pairs. W bosons are then detected through their leptonic decay (eν pairs, as well as μν pairs, and also τν pairs!), while Z bosons rely on the exceptionally clean ee and μμ decay modes as well as on the νν final state: neutrino pairs do not allow one to reconstruct the Z mass, but the event topology still permits the selection of Z candidates with high confidence.
Higgs decay products are selected as b-jet pairs with high combined transverse momentum; this reduces backgrounds and selects a clean topology. The measurement of the invariant mass of the b-jet pair is then improved by a regression technique that increases the separation power of that kinematic variable; the technique is based on the use of Boosted Decision Trees, a powerful multi-variate technique that is now common in HEP. The analysis makes use of the same technique also to boost the discrimination of the signal, such that at the end it is the output of the kinematical discriminant which is fit to extract a signal fraction.
The analysis includes many niceties which it is not reasonable to report on here - besides, the paper itself is not too hard to read if you are that curious. Nor will I enter a discussion of the treatment of systematic uncertainties. It is much more fun to attach here a few important graphs and comment them for you.
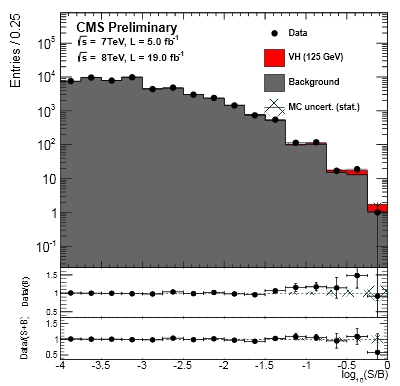 The first graph, shown on the right, has the data histogrammed in bins of equal expected signal to noise ratio, combining all sub-channels of the search (those defined by the accompanying vector boson kind and decay mode). This kind of plot allows one to see how in kinematical regions where one expects no signal contribution backgrounds are predicted with high precision, and then explore the regions where most of the signal is expected to appear. The data (black points) well agree with the hypothesis of coming from a mixture of backgrounds (grey) and Higgs signal (red), while if you take the signal off the data show a discrepancy with the background-only hypothesis.
The size of the discrepancy is, as I said above, not compelling: 2.1 standard deviations. However the graph shows that it is perfectly explained by the expected Higgs content of the data.
The other important figure (see below, left) is the one showing the upper limit on the Higgs cross section, as customary plotted in units of the SM expected cross section (the vertical axis). You might here well ask what is the purpose of such a graph now that we know the Higgs exists and has a production cross section in good agreement with standard model expectations. I will answer that one never knows whether other resonant states are lurking in the area, and besides, the graph still provides information on the level of agreement of the data with the background-only hypothesis (the center of the green and yellow band, in black dashes) and with the background plus 125-GeV SM Higgs signal hypothesis (dashed red curve).

The panel on the right instead shows the p-value as a function of Higgs mass. Here you can see that the excess is largest for a mass hypothesis of 125 GeV; but of course, since the mass resolution of b-quark jet pairs is not as good as that of pairs of photons, a 125 GeV Higgs signal will leak in searches targeting 120 or 130 GeV, producing an effect which is exactly as the one seen.
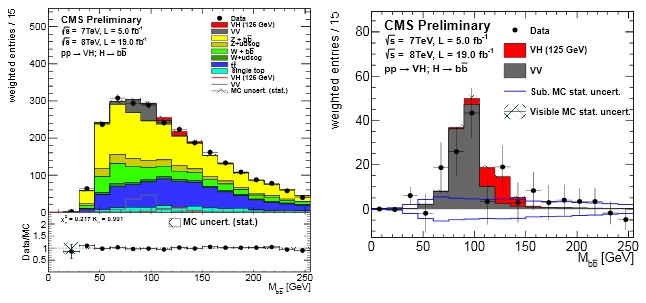
And I am leaving the most convincing plot to the end: below you can see the reconstructed mass of the b-jet pairs, which I think is quite lovely. Here you see on the left the full distribution, which includes most backgrounds; on the right you can see what happens if you subtract every non-resonant background and live out the VH (in red) and VV (in grey) contributions. It is exceedingly nice to see the VV excess to the left and the small but significant VH excess on the right! I remember writing a document back in 2000 (for a Higgs Jamboree meeting in Harvard) when I discussed how the VV contribution in such a histogram could be used to gain confidence of our selection methods... Thirteen years afterwards, seeing this graph makes my day!


Comments