

The educational purpose of this question is evident: everywhere, except in scientific publications, we see numbers quoted without an assessment of their uncertainty; this is a widespread practice which "lowers the bar" of the provided information, and it constitutes in my opinion a good choice for a bad practice where we should concentrate our efforts to improve the quality of science popularization and general awareness of the scientific method.
With hindsight I can say today that the case I took to make the point was, I fear, a bit too special and complex. Much better would have been to refer to a more clear-cut case, one whose general features can formulated, after some thought, as follows: imagine you have some prior knowledge of the value of a quantity you wish to estimate, coming from a measurement obtained with a device of unknown reliability. Now you are allowed to either re-measure the same quantity under different conditions with the same device, or to learn about the typical uncertainty of the measurements that the device produces. What do you choose to do ?
To make things more clear we could imagine that we want to measure our body weight, with a scale of dubious reliability. A month ago you got a weight of 180 pounds, but could not really know whether this was 180+-20 or 180+-2 pounds. This is your "prior information". Now you can either get another measurement, or learn about the typical uncertainty of the measurements the scale produces.
What would you pick ? Of course it would be better to know the uncertainty, which you could relate to the previous measurement to obtain a sound assessment of your true weight, modulo the possible smallish change in the last month; if you instead chose to remeasure your weight, you would get another measurement but you would still be unable to create a good model of the density function describing the actual weight.
Back to the Queue
Okay, now let us deal with the queue problem. In the last post I had discussed a call center, but here let me make the point that the problem is quite general, and applies with no changes to several situations: waiting in line to get a movie ticket, for instance, or waiting in one of the lines of a cashier at the supermarket. Note that there is a difference here: there is either one queue and the next in line is served, or there are multiple queues, with no chance to jump to a more favourable queue if yours is not making progress. I will only deal with the first case in this article, which is the way most of these systems are managed (and I hate the supermarket queue system in fact, since it is not really democratic and it increases the uncertainty of your waiting time, since you only rely on one clerk).
[As a side-note: Since there are many systems we could consider which are equivalent, and since this is a particle physics blog, let me mention in passing-by that a completely equivalent situation to that of a call center is the one of triggering event collection in a particle detector at a collider.
Here is the setup: particle collisions occur every few nanoseconds, and the detector is quickly read out. The information is stored in some temporary buffers, and a line is formed in front of several CPUs, each of which handles in turn one event, analyzing it as quickly as possible in order to determine if it passes some minimal requirement that flag it as interesting and worth storing in the limited-capacity storage system (the limited capacity is coming from the input data rate, typically of the order of a few hundred events per second). As you see, this model is totally equivalent to the call center.]
The queue problem is so common that indeed there is a whole theory on it, as a reader pointed out in the thread of the former post. There is even a very nice wikipedia entry on the topic, full of mean-looking formulas (the link is in the thread). However, it is not helping us much to dive into those formulas, because the question we want to address demands us to take a different viewpoint to the problem. Rather than formulas, which are notoriously forbidden in blog articles, we will use a Monte Carlo simulation of the system, which will allow us to learn the behaviour of the system in a more empirical way.
So here is again the system, specified with some care: a set of clerks handle phone calls for a call center. People who call in are set in a waiting line, and are served sequentially based on the time when they called.
Our original question was: do we prefer to know the call center's estimate of a waiting time for our call (what I called "case 1"; eight minutes was brought as an example), or the uncertainty the call center estimates for the waiting time ("case 2", one minute the possible datum), if given a chance ?
The important thing to keep in mind is that the way we use that information is to take a decision on whether to stay on the line, and we can assume that our behaviour is the following: we stay on the line if, given the data available, we estimate that the chance of having to wait more than 10 minutes is less than 10%. One can of course imagine a different decision rule, but it makes no big difference which one we pick.
The Know-Nothing Solution
If we make no assumptions on how the queueing system works, on how the estimates of waiting time or uncertainty are produced, and on the typical talking time per customer, there is no way we can meaningfully take a decision, of course: here is why.
In the first case we are given an estimated waiting time -eight minutes- but we have no idea whether this is 8 minutes plus or minus 5 seconds, which would imply that we should stay on the line (the probability of our waiting time to straggle past our fixed deadline of 10' is zero in that case), or whether instead it is 8 plus or minus 8 minutes, in which case we should hang the phone, since the probability that the wait will exceed 10' is close to 40%. So we cannot decide.
In the second case we are given a uncertainty in the waiting time -one minute- and we can't do anything with that either: is it two minutes plus or minus one, and so we stay on the line, or is it rather 20 minutes plus or minus one ? Not having a clue, we cannot decide.
In real life, the know-nothing approach is never followed. We are Bayesians by nature, so we tend to use our common sense to try and formulate hypotheses on what the typical duration of a call is, on the typical number of clerks, and so on; this can and should allow us to take a decision based on our prior beliefs. This leads me to exemplify a model one could put together in order to decide whether it is better to be in case 1 or case 2.
The Model
A call center is something a company uses to serve its customers. The company wants customers to be satisfied, so it wants to minimize the waiting time, or at least keep it at an acceptable level; however it also wants to minimize the number of clerks, in order to pay fewer salaries. At different times of the day there is a different flux of incoming calls, so the call center is usually tuned to handle the varying flow with a varying number of clerks.
Because of the above, we can safely assume that waiting times are "reasonable": on average, they will be of no more than a few minutes, say two to ten. It is quite unlikely that a call center is set up such that the average waiting time is much larger or much smaller than this range. At least, this is a reasonable assumption that we can use in our model.
What we need, however, is not the average waiting time, but rather the parameters that determine it: the number of clerks, the frequency at which customers line up, and the talking time per customer. Once we fix the number of clerks and the typical talking time, however, our requirement that waiting times are not outrageously large or too short will determine a balance between number of clerks and frequency of incoming customers. A Monte Carlo simulation will allow us to make sense of this balance, as I will show below.
The other assumption is the one concerning the distribution of talking time per customer: this of course varies significantly depending on the kind of service that is provided, but since we know the service in question we can construct a meaningful model for the time distribution of the service. I will assume that this distribution is a log-normal one. This has already been pointed out by a reader of the former post. A Gaussian model for the talking time is wrong: a Gaussian extends to unphysical negative times, and has tails of the same size around its mean. A log-normal (a function whose logarithm is a Gaussian function, so one of the form f(x) = exp(G(x;m,s)), where G is a Gaussian of mean m and width s) is instead the appropriate model for the process we are considering. As will be shown below, it has a long tail extending to arbitrarily long talking times, modeling the odd call of the confused customer.
Constructing a simulation
We can now try and code in a simple program the "prior beliefs" I outlined above, to see where they lead us. We construct a function with several pass parameters: the number of clerks in the queue, the average time between the arrival of two customers, and two parameters describing the model for the talking time per customer, which as I said above is a log-normal function. This can be the header of the function:
void callcenter (int Nclerks, double Tarrival, double Tave, double Tave_sigma, int MaxTime) {
So here we have a function which specifies the number of clerks, the frequency of clients, and the talking time (through the parameters Tave and Tave_sigma). The function simulates, in a time cycle, all the functions of the queue: the arrival of clients, the distribution of clients to free clerks, the talking period. It also simulates the call center's estimate of waiting time, which they base on their knowledge of the talking time distribution and the number of clients and clerks.
In blocks, the program looks as follows:
- define variables used in the various calculations
- time cycle:
- generate arrival of customers with a random number generator
- based on the number of clients in line and the model of waiting time, generate an estimate of the waiting time and of the waiting time uncertainty
- generate the management of the queue: if a clerk is free, it takes the next customer in line; a random number then decides how long will they be talking together before the clerk is again free to take a new customer.
- plot some summary graphs.
The program is not too hard to write - it took me about one hour of coding plus ten minutes of testing. I put it here in case you are curious to give it a look. Anyway here we just discuss the results.
Results
By playing with the input parameters, one can generate different curves for the distribution of talking time, and see how the two critical parameters we want to discuss -estimated waiting time and estimated uncertainty in the waiting time- depend on it, for several kinds of call centers. Note that once one specifies the distribution of talking times and the number of clerks, this more or less fixes the frequency of arrival of customers, because a too low frequency will make clerks mostly idle, and a too high one will quickly make the queue a very long one; both situations are assumed undesirable by the managers of the call center, so we disregard them.
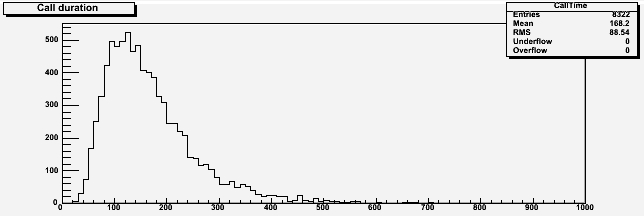 If I set for instance the parameters of the distribution of talking times as f(t) = exp(G(t;5,0.5)) I get the distribution of talking times shown above. As you can see, it is a reasonable model: the mean talking time is of almost three minutes, and most customers are done in less than six (here and in the following graphs, units are seconds on the x axis).
Let us use that model with a call center employing five clerks. In such a situation, we need to pick a sensible frequency of arrival for the clients, to allow for the typical waiting time to be in a meaningful range. We can then study how much the results change if we vary that datum.
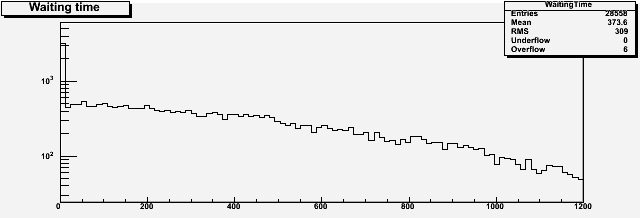
Above you can see the distribution of waiting time of customers if we assume an average incoming frequency of a customer every 35 seconds. The average wait is a bit above six minutes; a sizable fraction of lucky customers is served at once (the peak on the left), and some stragglers need up to 20 minutes to be served.
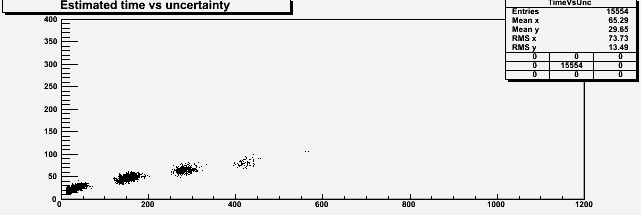
The above one seems a meaningful model for a five-clerks center. So let us give a look at the estimates that the center may provide, given the distribution of talking time and the frequency of clients above, of waiting time and uncertainty. These are shown in a scatterplot below, where the horizontal axis is the waiting time and the vertical axis is the estimated uncertainty.
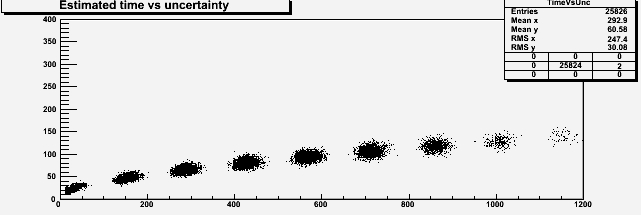
As you can see, the data points "cluster" in different islands: each island is populated by a situation when the number of customers in line is a multiple of the number of clerks. The spreads are due to the fact that the system evaluates the estimated waiting time using also the information on the time that each clerk has been talking with the clients being served.
Now let us pick a point corresponding to the first case of our original question: a waiting time estimated to be eight minutes (480 seconds, that is). With our prior assumptions on the number of clerks and the shape of the talking time distribution, we get to know that if the system tells us that the waiting time is eight minutes, the uncertainty in this estimate is also rather well-determined: it is of the order of seventy to eighty seconds (the intercept on the vertical axis of the points lying at x values of about 480 seconds)!
If instead we consider the case when we are given the uncertainty, we see that a sixty seconds uncertainty may correspond to waiting times in one among the second, third, and fourth cluster from the left. This means that the waiting time may be around 150 seconds, or around 290, or around 430 seconds; it is most likely around 290 seconds, given the relative density of those islands.
So in the considered case, and with the assumptions we have made, both an estimated waiting time (8 minutes) or an estimated uncertainty (1 minute) allow us to take a decision: in the two cases we are looking respectively at a wait of 480+-80 seconds or 290+-60+-140 seconds, where here the second uncertainty in the "case 2" estimate is due to our imprecise estimate of the waiting time due to the three possible "clusters" where we may be sitting.
But how general are these conclusions ? Above we have assumed, quite freely, that there were five clerks in the center. Let us change that parameter, keeping the other ones constant, and see what we get.
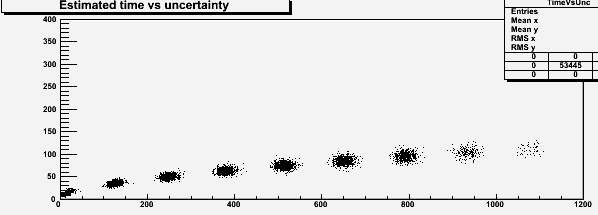
If we take 10 clerks, and keep the talking-time model constant, we need to assume a frequency of a customer every 17.3 seconds in order to have a similar average waiting time of six minutes or so. The resulting scatterplot of estimates of wait and uncertainty is shown above. One sees that an estimated of eight minutes corresponds to an uncertainty in the same ballpark as before (about 80 seconds), while a uncertainty of 60 seconds now corresponds to the third, fourth, or fifth cluster, sitting at waiting times of 250, 390, and 530 seconds. We see that our prior belief on the number of clerks serving the queue has a significant impact on the conclusions we may draw for our waiting time if we are working with a estimated uncertainty, while our conclusions will stay the same if the datum we are given is the estimated waiting time.
Now let us instead investigate what changes if, by keeping the number of clerks constant, we vary our assumption for the average waiting time. We do so by changing the frequency of arrival of customers, for the case of five clerks. If we take five clerks and a rate of a client every 40 seconds we get of course a narrower distribution of waiting time. Now the mean wait is of half a minute: this is a very effective call center!, and probably one which is using too many clerks for the rate of customers it has. Anyway, the graph of estimated waiting times versus estimated uncertainty (see below) does not change qualitatively; only, there are this time fewer clusters, because it is very rare for such a setup to give large estimated waits. We are led to conclude that if we believe we are facing an effective call center, the information on the uncertainty is now almost as informative as the information on the estimated wait, because there are fewer clusters to which the uncertainty may correspond to.
If we had started with ten clerks, decreasing the frequency of arrival of customers such that the average wait becomes similar to the case just considered would also modify the scatterplot in a similar way. We start to understand how the system works: given an average waiting time -determined by the number of clerks and frequency of customers- our call will belong to one of those "clusters" in the scatterplot, depending on how many clients are waiting in line before us. The way these clusters are spaced with respect to one another depends on the average waiting time; their width depends on how wide is the distribution of talking time per customer.
In Summary
What I hope I have convinced the four readers who got this far down this article is that a Monte Carlo simulation is a wonderful thing, enabling one to explore the functioning of complex systems such as a call center with little effort.
As for the question that started this whole thing, I believe we have learned something: there is information in both an estimate produced without an associated error, and in an error without the central value it refers to. Just how much information is contained in each datum depends on the details of the problem; but most importantly, the information can only be appreciated if we add to the problem some prior belief on the unknown parameters which determine its behaviour. If we are unwilling to make any assumption, then for sure an estimate without an uncertainty is totally useless, just as much as is a uncertainty without a central value!


Comments