

Today, the top quark mass is measured with a 770 MeV uncertainty and the W boson mass with a 15 MeV uncertainty. That alone is a reduction of a factor of 10 in the allowed phase space of those two parameters; but crucially, we no also know the Higgs mass with a 0.5% accuracy. This leaves very little space for the true parameters of the standard model. On the other hand, if the SM were to be enlarged to a minimal version of Supersymmetry, then the theory predictions would blow up considerably, as the MSSM allows much more freedom to those parameters as others (like squark masses) are varied.
The summary of the experimental situation is shown in the graph below, which Sven Heinemeyer produced today for this blog (thanks Sven). The graph summarizes calculations produced by Heinemeyer and his colleagues Hollik, Stockinger, Weiglein and Zeune. In the graph the horizontal axis shows possible values of the top quark mass, in the very restricted range allowed by the latest world's best CMS measurement; the vertical axis shows values of the W boson mass, in an even narrower range in absolute terms, thanks to precise measurements of that quantity performed by LEP2 and the Tevatron experiments. The experimental determination of those two parameters is symbolized by a grey ellipse which encompasses 68% of their probable values.
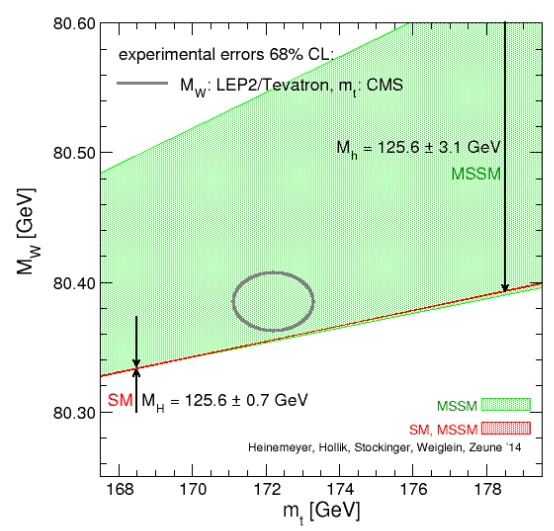
Then if we stay within the standard model, the Higgs boson mass measurements by the CERN experiments (+-0.7 GeV) force the two parameters to be bound to lie within the very narrow red line; if instead we take the MSSM as the true underlying theory, the whole green area is possible; different points of this area correspond to different value of other parameters (here a more liberal variation of the Higgs mass is taken, to cover more possibilities). The downward arrow symbolizes that as one increases the "mass scale" of the MSSM the allowed region moves closer to the SM line.
Note that in this graph the grey ellipse and the red line are the only experimental inputs; there is no "LEP indirect" oval here, as this would be too wide for the graph. In other words, the precision electroweak information from the Z boson studies of the nineties has become largely irrelevant in this particular view (it remains a formidable input to verify the general agreement of SM and data, if one studies other parameters).
So, what should we carry home from this graph ? I believe at least two things. One, that the SM likes the W mass to be a bit lower than what is currently measured, and the top quark to be a bit higher; the tension is however only mild -we are talking about just a bit more than one standard deviation for the disagreement. Two, that the MSSM is not killed by these measurements - it would live on regardless of the precise values of W and top masses, as the breadth of the green area shows.
Oh, and a third thing - the experimental measurements of these quantities rock!
Other considerations can be made, but I will stop here for tonight. Tomorrow I will be on a train at 6 in the morning, to participate in a 2-day open discussion organized by INFN in Rome, called "WHAT NEXT". A very interesting discussion on the long term plans of italian research based on the current status of particle physics, astrophysics, cosmology, and other fundamental investigations. I will have something to report on that later on...


Comments