

Before I write another line about ice, I want to thank all of my readers. Whether or not you leave comments, whether or not you link in other blogs, just knowing that I have so many readers gives me the encouragement to keep going: to keep up the standards I have set myself.
One of the standards I set for myself is to always remember just how much I don't know. We have much still to learn about the Arctic. Just when we think we know all there is to know, you can be sure that nature will remind us most harshly of our blind ignorance.
Arctic ice July update #1
In Arctic Ice July 2010 I wrote:
In about a week the National Snow and Ice Data Center - NSIDC - will be publishing its analysis of June's sea ice. I expect them to report another record loss of sea ice.
In the NSIDC report of July 06 2010 they write:
Average June ice extent was the lowest in the satellite data record, from 1979 to 2010. Arctic air temperatures were higher than normal, and Arctic sea ice continued to decline at a fast pace.
...
At the end of May 2010, daily ice extent fell below the previous record low for May, recorded in 2006, and during June continued to track at record low levels. By the 30th of June, the extent was 510,000 square kilometers (197,000 square miles) below the same day in 2006.
http://nsidc.org/arcticseaicenews/2010/070610.html
I don't think that any rational observer would be surprised to see those words in the report, given the ice losses seen in MODIS images. What is probably surprising to many Arctic watchers is their projection for July:
... it would not be surprising to see the rate of ice loss slow in coming weeks as the melt process starts to encounter thicker, second and third year ice in the central Arctic Ocean. Loss of ice has already slowed in the Beaufort and Chukchi Seas due to the tongue of thicker, older ice in the region noted in our April update.Much depends on patterns of wind, current and general warming. If the main pack expands into warmer waters it will melt faster than might otherwise be the case. The warm waters are there. They are shown in MODIS LST images. They are also revealed by patterns of phytoplankton blooms.
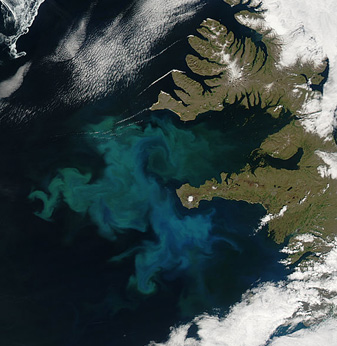
Phytoplankton Bloom off Iceland - June 24 2010
This image of the day for July 08 is available in larger sizes at:
http://modis.gsfc.nasa.gov/gallery/individual.php?db_date=2010-07-08
That web page also contains useful information about Arctic phytoplankton blooms.
Phytoplankton - or algal - blooms are a good proxy for water temperatures, as are the brighter green cyanobacterial blooms.
Here is a MODIS near-realtime image of the area of algal bloom shown in the above image, together with the corresponding MODIS LST image.
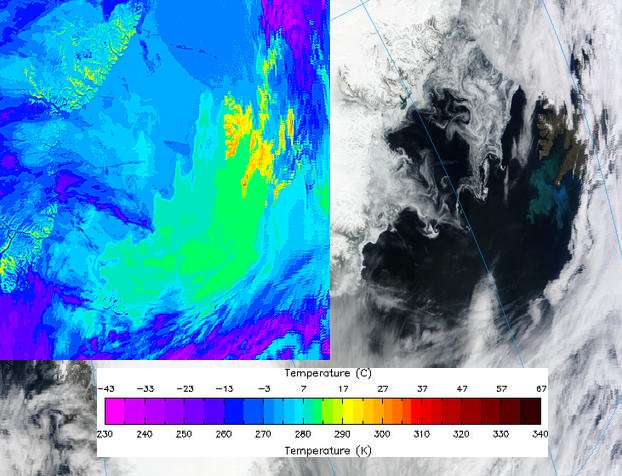
MODIS/Terra 2010/175 06/24/10 14:15 UTC
http://rapidfire.sci.gsfc.nasa.gov/realtime/single.php?T101751415
Arctic albedo
The Arctic has been warming from south to north as might be expected. The warming has melted snow and ice, bringing about general changes in albedo. Although the change follows a general pattern of concentric circles there are regional variations. For example, the western and Scandinavia areas have warmed faster than the area from Chukchi Sea to Kara Sea.
This animation shows the vanishing snow cover and the greening of some of the land.
Some areas on the Siberian side of the Arctic are now warming faster than the Alaskan and Canadian areas. The warming is now spreading from the Chukchi Sea to Kara Sea areas towards the New Siberian Islands. In an earlier article - Arctic Tipping Points - #1 - I referred to an 'Arctic triangle'. I reproduce the map here.
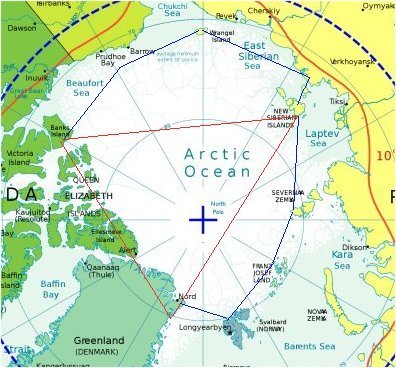
From the article linked above:
The blue lines show an area appended to the triangle within which ice extent has, until recent decades, tended to fluctuate greatly in location, whilst maintaining a fairly constant thickness and extent. Between the blue lines and the coast ice, thickness and extent has varied widely in summer extent in former times. Until recent decades only portions of those waters were at all navigable in summer.
The point marked 'Nord' is Nordostrundingen. The ice in that area has mostly retreated to the shore, leaving the small ice cap - Flade Isblink - clearly visible. That ice cap is the source of tabular icebergs which can, by becoming grounded, act as pins for sea ice in the Fram Strait.
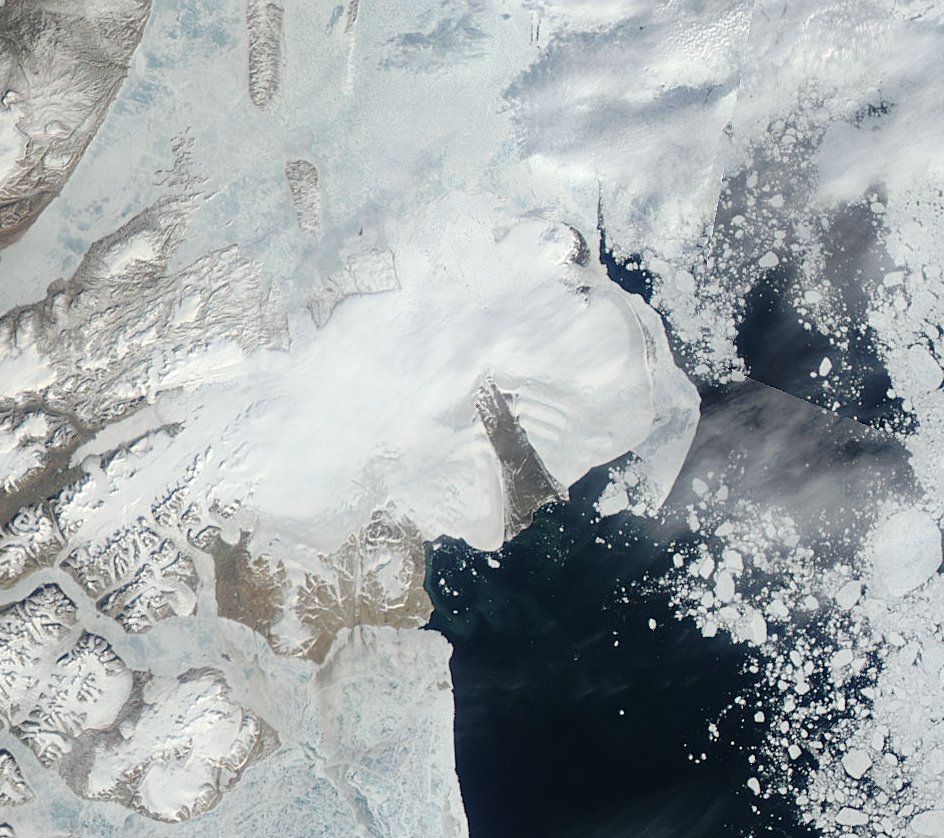
Flade Isblink - section from a MODIS image
http://rapidfire.sci.gsfc.nasa.gov/subsets/?subset=Arctic_r03c03.2010189...
Note the algal blooms, showing warm waters. The next image is a cropped and rotated LST image to show general temperatures in the area.
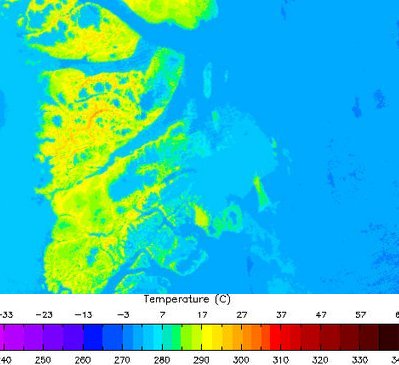
Flade Isblink LST - section from a MODIS image
http://rapidfire.sci.gsfc.nasa.gov/realtime/single.php?2010189/lst1.A201...
The coasts of Greenland and the Canadian archipelago show similar degrees of warming. The Bering Strait area is warming more rapidly, as shown in the next images.
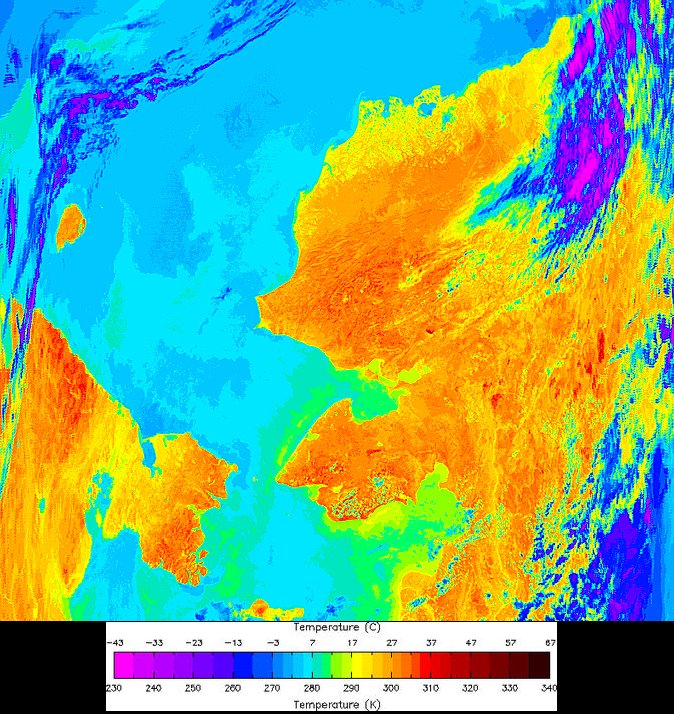
Bering Strait LST - detail from
http://rapidfire.sci.gsfc.nasa.gov/realtime/single.php?2010189/lst1.A201...
Compare the temperatures shown with the next image showing algal blooms and sediments.
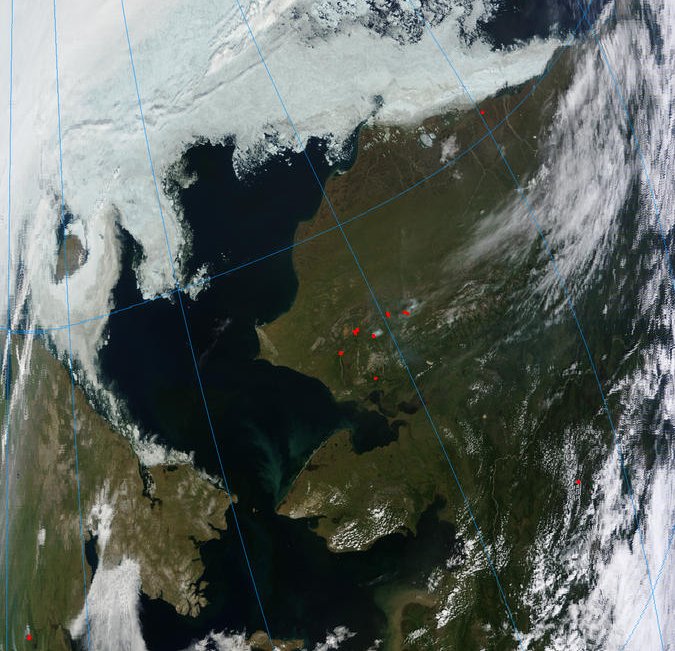
Bering Strait - detail from
http://rapidfire.sci.gsfc.nasa.gov/realtime/single.php?2010189/crefl1_14...
Note the tundra fires - another proxy for temperatures. There are more tundra fires in the next image, which covers the East Siberian Sea from Wrangel Island - right of image - to the New Siberian Islands - left of image.
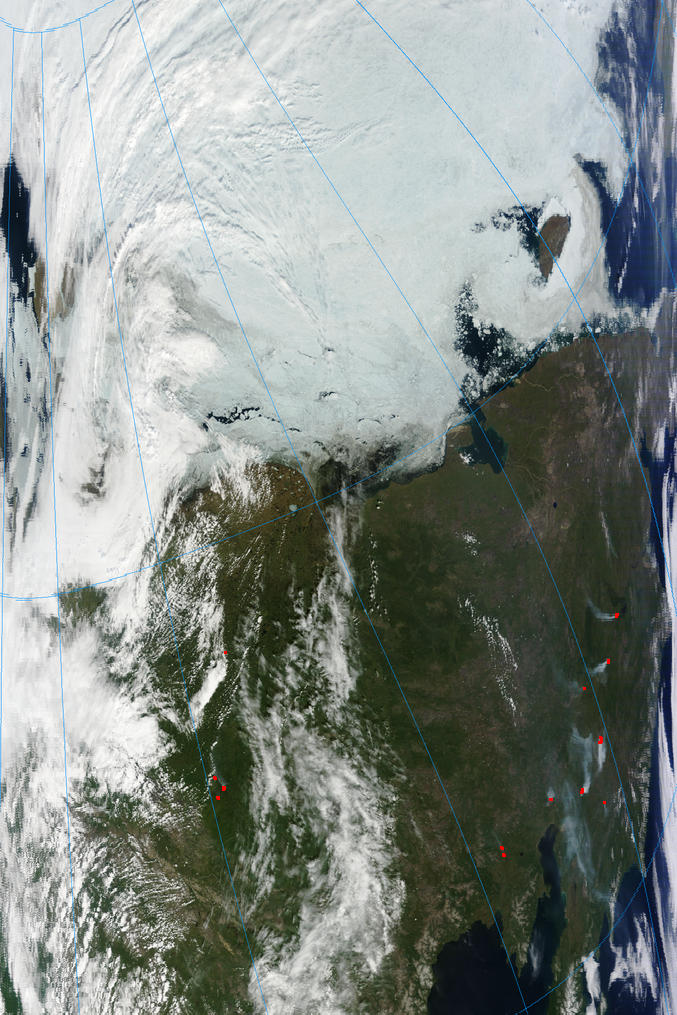
East Siberian Sea
http://rapidfire.sci.gsfc.nasa.gov/realtime/single.php?T101890115
Now check out those Siberian temperatures.
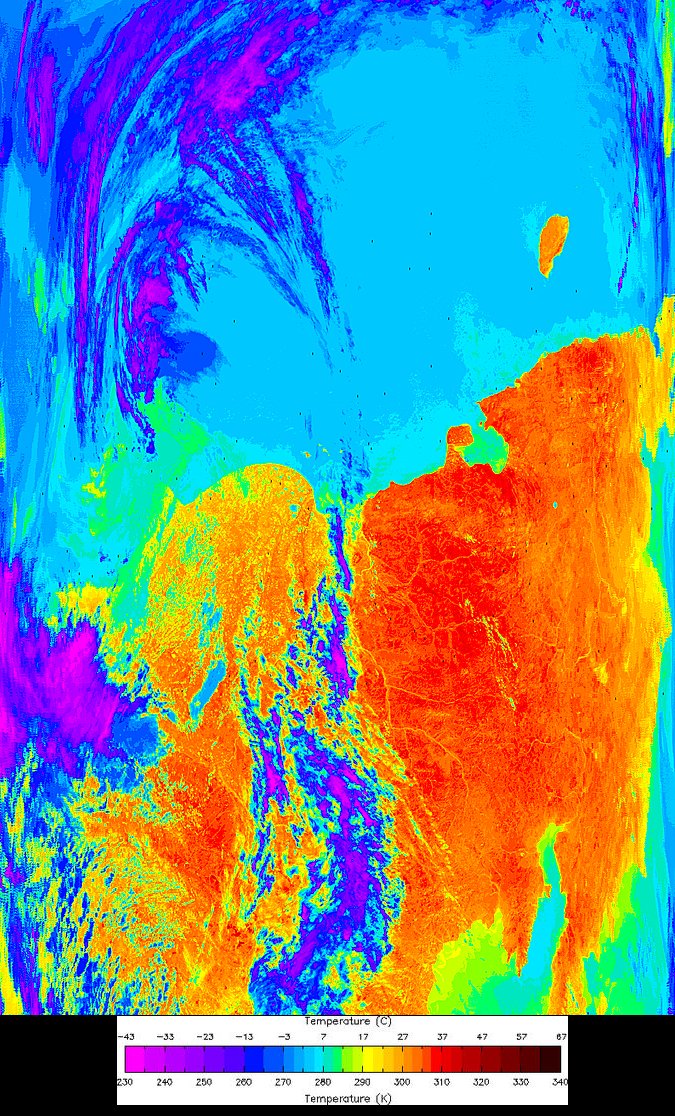
East Siberian Sea LST
http://rapidfire.sci.gsfc.nasa.gov/realtime/single.php?2010189/lst1.A201...
Projection
The Arctic will continue to warm in the area from the Kara Sea to Bering Strait. The greatest loss of ice through July - apart from the continuing Nares Strait ice loss - will be in the area bounded by the blue line in my 'triangle' map: Banks Island - Wrangel Island - New Siberian Islands.
-----------------------------------------------------------------------------------------------------------
There has been too much to write about in one update, so I will post another update soon.
Meanwhile, you may wish to check out these animated projections for a 21st century Arctic:
http://arctic.atmos.uiuc.edu/IPCCedu/tempice-cccma.shtml
Recommended blog for updates, links and generally useful info for Arctic watchers:
http://neven1.typepad.com/blog/


Comments