

In about a week the National Snow and Ice Data Center - NSIDC - will be publishing its analysis of June's sea ice. I expect them to report another record loss of sea ice.
My prediction for July is that Arctic sea ice loss will accelerate.
Measuring ice behaviour
Ice is a material with mechanical properties. In order to understand what it is doing at any moment and what it will do in future, one must understand its properties. Sea ice is a special case of ice as a particulate material. The fluidity of a particulate mass is a matter of basic physics which is independent of scale. Particle size can range from microns to kilometers, it is all one to the laws of physics.
In the absence of a force tending to produce clumping, particles on a fluid surface tend to spread out. Imagine a swimming pool topped off with a foot thickness of polystyrene beads. You have to remove a lot of beads before you can see water. In the absence of air or water movement causing the beads to pile up, they will spread out. It will be a very long time before removal of the beads reduces their distribution per unit of water area to 15%.
Measuring ice by extent is like measuring those beads by their distribution. An entirely arbitrary cutoff point of 15% is used for ice extent.
For as long as the whole area of ice within the Beaufort Gyre is at greater than 15% distribution, that whole sea area will be included in measures of ice extent as if it was 100% ice covered. Measures of extent do not discriminate between levels above 15% distribution.
This map from NSIDC shows the major ice streams in the Arctic regions.
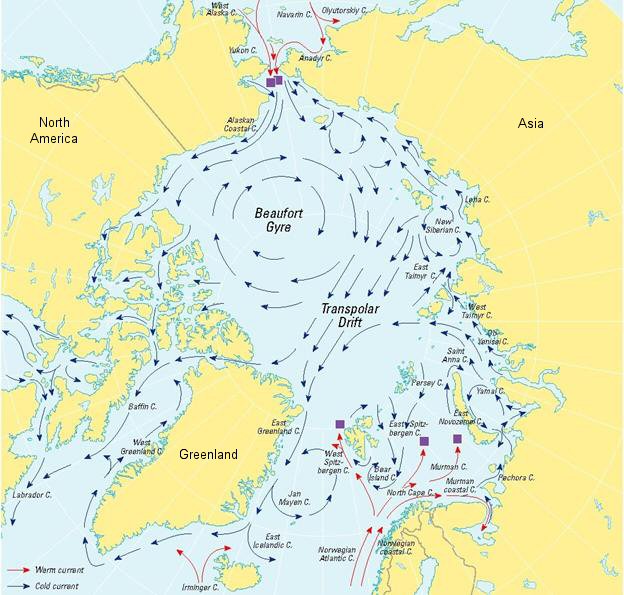
http://nsidc.org/seaice/processes/circulation.html
The Beaufort Gyre and the Transpolar Drift are the two major ice motions in the Arctic. The enormous forces generated within the pack by these motions are a key driver of ice formation and compaction. In normal times, as tensions open a lead, it freezes over. Compression fractures the new ice and squeezes it into the pack. Ice sheets and slabs over- and under-ride each other. Broken ice is pushed onto and under the pack. Even during the summer, when the ice margins are melting, the main body of ice thickens and strengthens.
Ice thickens by compression when its motion is obstructed. Remove the obstruction and the ice will not thicken: it will just continue in its motion. The Beaufort Gyre, the Transpolar Drift and other ice flows can only thicken the ice if there is an obstruction: an opposing force.
At the point where the Beaufort Gyre and the Transpolar Drift thrust the ice against Ellesmere Island and the North coast of Greenland, the back-pressure of land will normally cause a great thickening of the ice. Ice is forced ashore until the drag exerted by the ground overcomes the thrust exerted by the ice from seaward. Thereafter, the ice piles up in huge ridges. This ice is so thick and so consolidated that it can persist long after the sea ice has melted away.
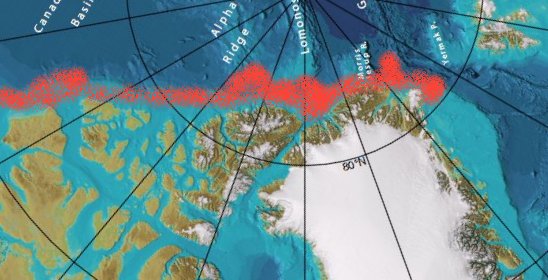
Along the coasts of Greenland, Ellesmere Island and Queen Elizabeth Islands the ice would normally be subject to enormous pressures. Over the course of thousands of years the ice along those coasts built up as ice shelves. They are gone. They will not - cannot - return for as long as open passages permit the pressure to be relieved. In their stead is an area of highly fragmented ice - shown in red below.
The North West Passage is nearly open. Just a few more days will see the end of the ice bridge that was blocking the main passage. The broken ice in the passage will then more readily flow out and melt.
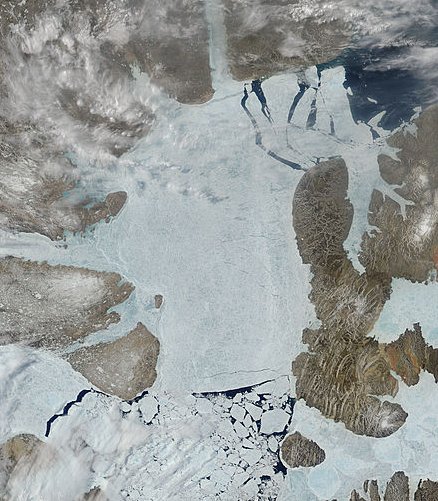
Ice bridge break-up in Viscount Melville Sound
MODIS aqua image June 28 2010
http://rapidfire.sci.gsfc.nasa.gov/subsets/?mosaic=Arctic.2010179.terra.4km
The Nares Strait - the strait which opened in July 2007 and exported a substantial amount of the ice that year - has been open since last year. Briefly, in March, it appeared that an ice bridge might form, but it did not happen. In 2009 an ice arch formed in the Lincoln Sea, completely blocking the export of ice through the Nares Strait.
With the Nares Strait entrance obstructed, two things were observed. Firstly, the Nares Strait and Baffin Bay were soon swept clear of sea ice. There was a lot of open water. Secondly, the ice in the Lincoln Sea area thickened. This year the Nares Strait is passing a stream of ice into Baffin Bay. That rapidly melting ice would be thickening the main pack in a normal year.
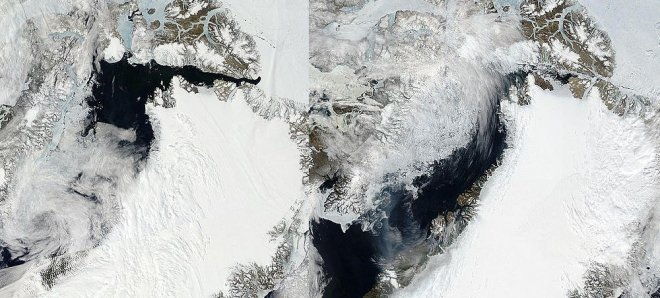
Arctic mosaic images for
http://rapidfire.sci.gsfc.nasa.gov/subsets/?mosaic=Arctic.2009177.terra.4km
http://rapidfire.sci.gsfc.nasa.gov/subsets/?mosaic=Arctic.2010177.terra.4km
Edit: thanks to Andrew Xnn for spotting my date error, above.
Ice extent and error doubling
Ice extent as defined by NSIDC is a count of grid areas of 25 x 25 km which contain at least 15% sea ice. The method completely misses the loss of ice and consequent loss of mechanical strength within the Beafort Gyre. The NSIDC method counts ice lost from the Beaufort Gyre as ice added to Baffin Bay. This shows up in extent plots as a surplus of ice rather than a loss.
Lesser amounts of ice are being lost all across the Arctic. The reason, I suggest, is this. Tightly packed ice pressed together thickens up. Ice which is so fragmented and so interspersed with open water that it behaves as a fluid will simply vary in its dispersal patterns but will not usually consolidate. Winds and currents which would normally consolidate the ice merely serve to fragment it more in most places.
The Beaufort Gyre and the Transpolar Drift normally act as a giant compressor, forcing ice hard up against immovable shores. This year they are acting more like a giant grinder, increasing fluidity.
There is at least some thick ice. The USCG Cutter Healy has been surveying the Arctic near Alaska. The skipper reports plenty of rubble and ridges in one area of ice surveyed.
The floe we have spent the last couple days in is a vast floe, miles and miles across, made up of a bunch of smaller flows that mixed up through the long Arctic winter. This resulted in pressure ridges and rubble piles over 30 feet thick, and quite a few areas where two floes got stacked up and are well over 10 feet thick.
http://blogs.nasa.gov/cm/newui/blog/viewpostlist.jsp?blogname=icescape
The USCGC Healy's position is shown on a frequently updated map.
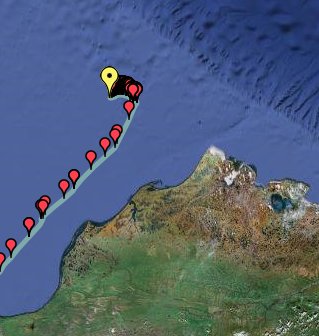
http://www.icefloe.net/cruisetrack.html
The aloftcam pictures are updated every hour. This animation shows Healy set in a floe.
Animation of aloftcam images from:
http://mgds.ldeo.columbia.edu/healy/reports/aloftcon/2010/
To get a better impression of scale, watch lower left as the gangway is lowered and figures appear on the ice. Lumps of ice can look small from a satellite, or even a webcam. It takes a human figure to give a true sense of scale.
I shall continue to monitor the Arctic ice. I hope to continue posting updates with my observations and predictions.
Edit: update #1 for July is now posted: Arctic Ice July 2010 - Update #1
Related / further reading:
http://www.uscg.mil/pacarea/cgchealy/media.asp
http://climateprogress.org/2010/06/27/arctic-sea-ice-extent-volume-recor...


Comments