

This is my first update to Arctic Ice September 2010.
As the Arctic melt season draws to a close there are still a very few people writing about recovery. A trend towards recovery would be a reversal over at least a decade of all current Arctic ice loss trends. A reversal would show ice becoming older, thicker and less mobile on average year-on-year. In fact, the trend is clear: the ice is becoming younger, thinner and more mobile year-on-year. If that trend continues - and I can see no reason why it should not - then we shall soon see an essentially ice-free Arctic Ocean in the summer. 'Soon' could well be 2011.
In my January 16 2010 article Global Cooling : Beyond Parochialism I made some predictions about the Arctic, including these:
2010:Many hottest weather records have indeed been broken. So much so that we have seen fires in Russia, Alaska and Canada caused by the ignition of tinder-dry tundra and taiga.
Many hottest weather records are broken in northern hemisphere.
Summer arctic ice at record low in extent.
By September the Arctic Ocean is freely navigable by both the northern sea route and the north west passage.
2011:
Reduced ice cover affects sea temperatures, in turn affecting Arctic current flows and air movements. Thinner ice, instead of piling up as pressure ridges due to compression effects, cracks into sections due to tension and agitation effects.
The Arctic is virtually ice-free by late summer: there is open water at the North Pole.
The summer Arctic sea ice extents were indeed at record lows. There follow a few extracts from NSIDC reports, and then some visuals.
The rate of decline through the month of May was the fastest in the satellite record; the previous year with the fastest daily rate of decline in May was 1980. By the end of the month, extent fell near the level recorded in 2006, the lowest in the satellite record for the end of May. Despite the rapid decline through May, average ice extent for the month was only the ninth lowest in the satellite record.NSIDC speaks of sea ice extent to describe the state of sea ice. Extent measures the sea area over which at least 15% ice may be found. The Cryosphere Today speaks of concentration. This is much the same thing as extent, but where NSIDC uses a simple logic where <15% plots as no ice and >=15% plots as ice, the CT maps plot the percentages as concentration values. In general, areas of high concentration tend to contain older and / or thicker ice, so concentration in area is a reasonable first approximation for ice concentration in volume.
http://nsidc.org/arcticseaicenews/2010/060810.html
Average June ice extent was the lowest in the satellite data record, from 1979 to 2010. Arctic air temperatures were higher than normal, and Arctic sea ice continued to decline at a fast pace. June saw the return of the Arctic dipole anomaly, an atmospheric pressure pattern that contributed to the record sea ice loss in 2007.
http://nsidc.org/arcticseaicenews/2010/070610.html
The rate of ice loss slowed in the first half of July, primarily because of a change in atmospheric circulation. The dipole anomaly, an atmospheric pattern that dominated the Arctic in June, broke down. It was replaced by a pattern of low-pressure systems tracking across northern Eurasia and then into the central Arctic Ocean.
...
[despite the dipole anomaly -]
...
Ice extent remained lower than normal in all regions of the Arctic, with open water developing along the coasts of northwest Canada, Alaska and Siberia.
http://nsidc.org/arcticseaicenews/2010/072010.html
Arctic sea ice extent averaged for July was the second lowest in the satellite record, after 2007. After a slowdown in the rate of ice loss, the old, thick ice that moved into the southern Beaufort Sea last winter is beginning to melt out.
http://nsidc.org/arcticseaicenews/2010/080410.html
The end of summer is approaching in the Arctic; temperatures are dropping and melt is ending in the high latitudes. Yet summer is not quite over in the lower latitudes of the Arctic Ocean, where sea ice extent continues to decline. Sea ice has melted out extensively in the northern route of the Northwest Passage, but the passage is not completely open.
http://nsidc.org/arcticseaicenews/2010/081710.html
Arctic sea ice generally reaches its annual minimum extent in mid-September. This August, ice extent was the second lowest in the satellite record, after 2007. On September 3, ice extent dropped below the seasonal minimum for 2009 to become the third lowest in the satellite record.
The Northwest Passage and the Northern Sea Route are largely free of ice, allowing the potential for a circumnavigation of the Arctic Ocean. At least two expeditions are attempting this feat, the Norwegian explorer Borge Ousland and the Peter I yacht from Russia.
http://nsidc.org/arcticseaicenews/2010/090710.html
A comparison of ice concentration images from September 06 2009 and 2010 shows that in the course of a single year the area within which a reasonable volume of ice could be found has shrunk greatly.
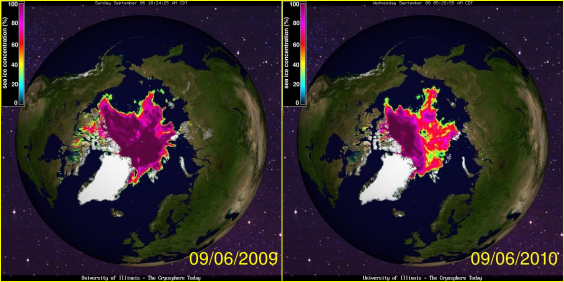
image source: http://arctic.atmos.uiuc.edu/cryosphere/
The next image is an animation of images from every 5th day between August 30 2009 and September 05 2010.
.
images source: http://arctic.atmos.uiuc.edu/CT/NEWANIM.ARCTIC.0/
The animation shows the ice extent growing from September 2009 to early April and then declining. The concentration, however, grows only to about mid January and then begins to decline.
The rise in extent to early April added young, thin, salty ice - the kind of ice that melts away most rapidly.
Based on the supposition that the great amounts of young ice would melt or disperse rapidly I predicted an end of year low extent of 3.5 to 3.8 million km2. The stalling of the Beaufort Gyre and Transpolar Drift had a significant effect on ice loss. Thus far the ice extent is only just below 5 million km2.
Before I move on to show actual images of the ice, here are some graphs of extent and area.
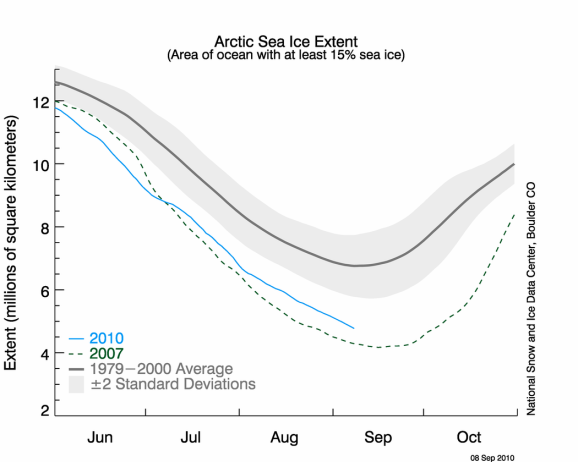
image source: http://nsidc.org/arcticseaicenews/
.
.
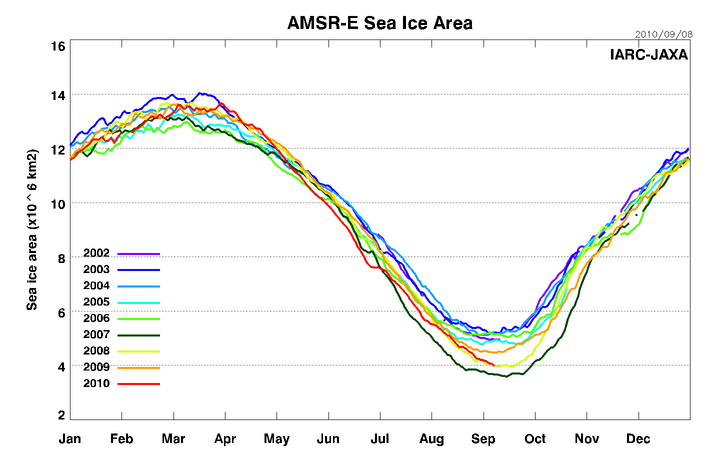
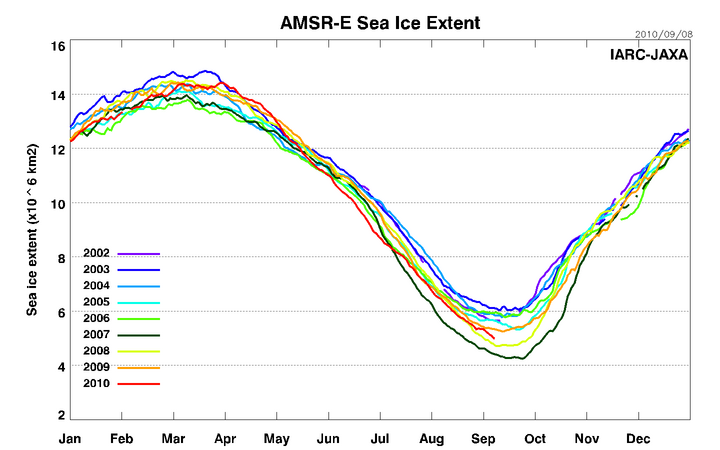
IARC - JAXA images source: http://www.ijis.iarc.uaf.edu/seaice/extent/.
.
.
Arctic mosaic
The following images are taken from a recent MODIS Rapidfire Arctic mosaic. It is interesting to compare these images with the Cryosphere Today concentration maps. The computed color-coded concentrations coincide well with real color satellite images.
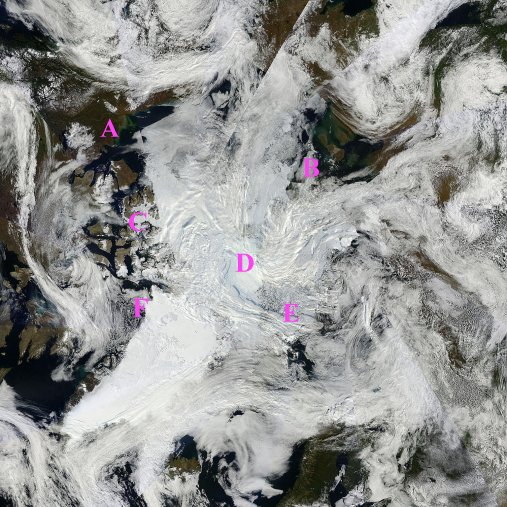
Annotated mosaic showing locations of subsequent images.
original images source:
http://rapidfire.sci.gsfc.nasa.gov/subsets/?mosaic=Arctic.2010250.terra.4km.
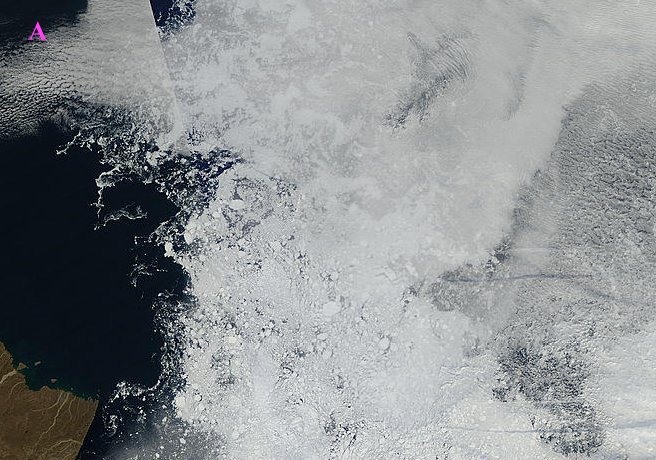
A - entrance to North West Passage.
.
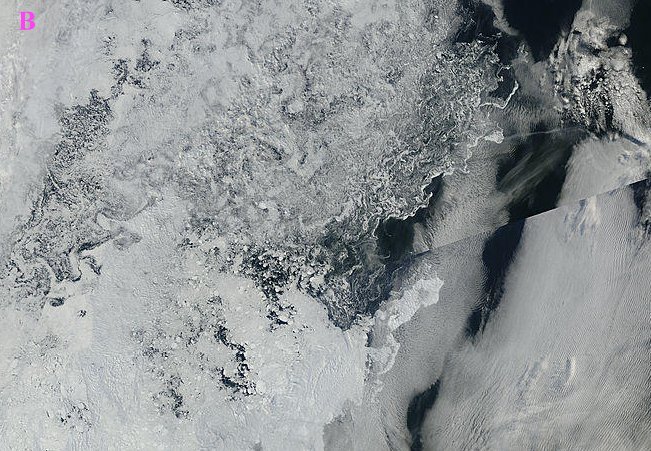
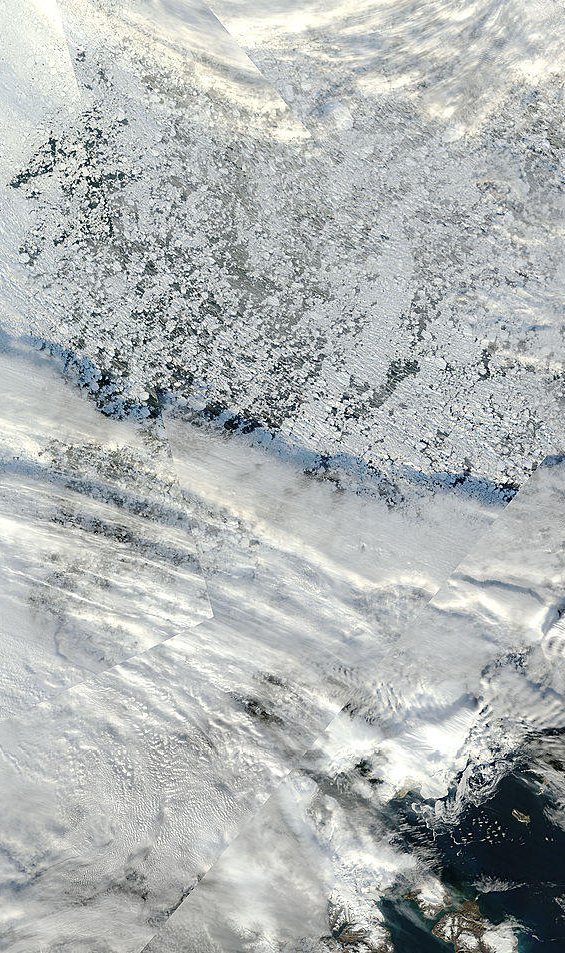
B - East Siberian Sea
.
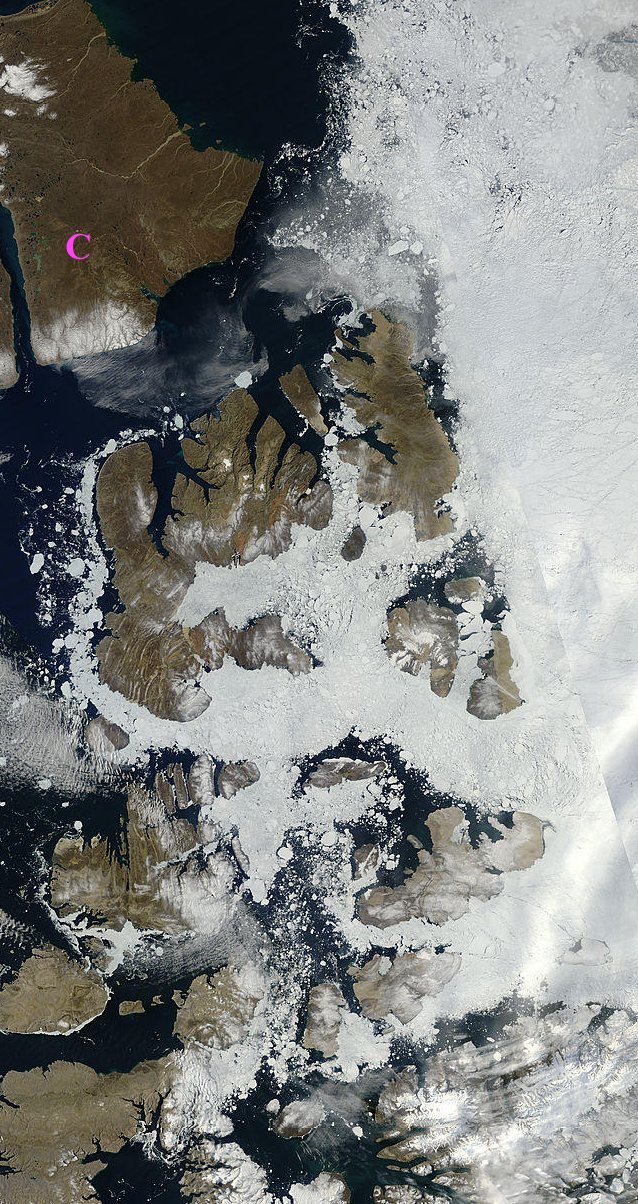
C - Canadian Archipelago
.
D - North Pole
.
E - north of Svalbard
.
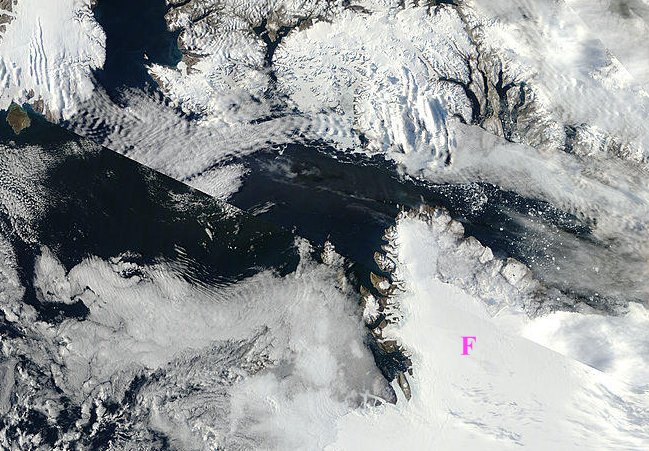
F - Baffin Bay
.
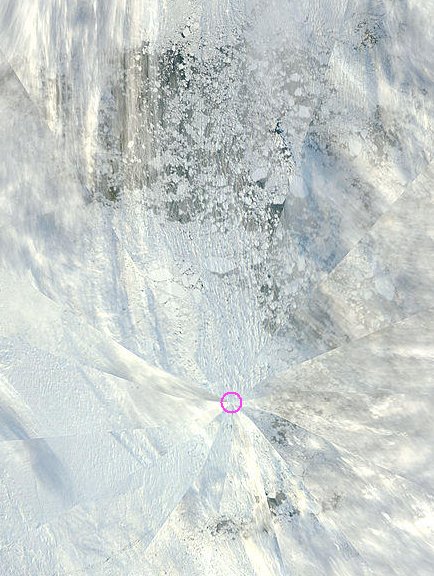
The North Pole camera
The camera located on a floe, originally close to the North Pole, shows thick snow. The ice has thinned during summer, so it is unlikely to be able to carry much weight of snow without being submerged. The floe is headed south towards warmer waters. From images in which the sun appears it is possible to deduce that the camera is pointing roughly south east.
It is very difficult to judge from photos, but the mirage-like appearance at the camera's horizon could be due to open water. It seems that there is a race on. Will the ice freeze together and keep the floe from drifting further south, or will the floe break up as it enters warmer waters?
Time will tell.
.
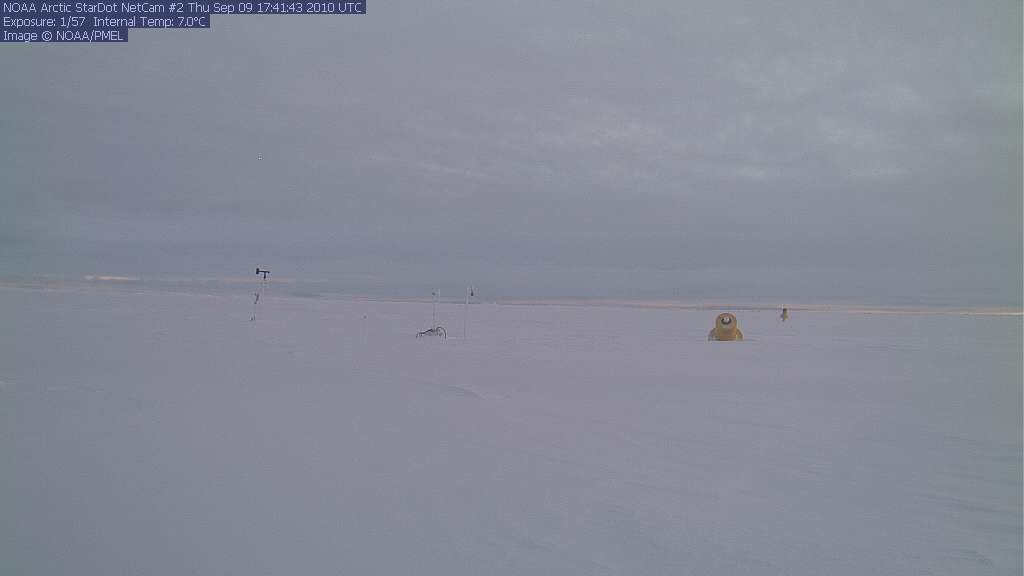
'North Pole' camera image September 09 2010 - 17:41 UTC.
.
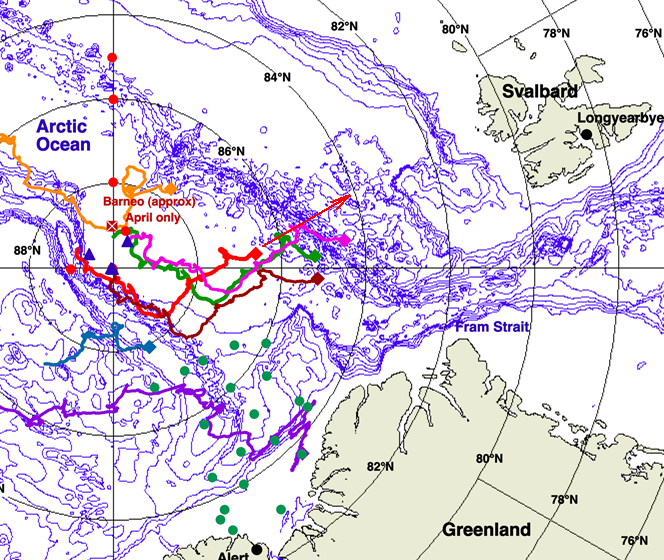
'North Pole' camera location September 09 2010.
Camera image and map source: http://www.arctic.noaa.gov/gallery_np.html
The map is a section of a full map from NOAA. I have added an arrow in red to show what appears to me to be the likely direction in which the camera is currently pointing.
Further reading:
Neven continues to post some very perceptive blogs which stimulate a lot of intelligent discussion of the Arctic. His most recent article on current sea ice extent is:
http://neven1.typepad.com/blog/2010/09/sea-ice-extent-update-29-riding-t...
Related:
Many more of my Arctic-themed articles can be found in
The ChatterBox Arctic Index


Comments