

Will it get very warm in the Arctic this summer?
It is already so warm in many parts of the Arctic that floes which would normally obstruct the free flow of ice for weeks or months are now surviving only days before breaking up. That is abnormal. The long term trend in summer peak temperatures shows little rise. That is because most of the rise has occurred outside of the summer season.
Before moving on, I have to give credit to Neven for the astute observation about summer temperatures.
Neven has correctly identified that most of the temperature change north of latitude 80 deg. has occurred, not in the summer, but in winter/spring/fall.
Open Mind, Arctic non-analysis, September 4, 2009
http://tamino.wordpress.com/2009/09/04/arctic-non-analysis/
He also beat me to the punch in writing1 about an ice floe that briefly blocked the Nares Strait, the one shown in the animation below.
Area, extent, concentration or what?
No scientist worth their salt would mix imperial measures with the metric system within one model. Paint applied in pounds per square millimeter doesn't make sense.
The terms used in discussing Arctic sea ice must be precise and self-consistent, else the debate is meaningless. Similarly, graphs derived from volume cannot fairly be used in sequence with graphs of sea ice extent to 'prove' any point other than the inherent invalidity of the method.
NSIDC satellite data goes back to 1979. The method used to determine sea ice extent has remained the same since NSIDC first began producing sea ice extent graphs and maps. This means that the comparison of year with year using NSIDC data is a valid method. For all that the data contains known errors, the errors are likely to be consistent year-on-year. This means that NSIDC data is a self-consistent source for plotting trends. The trend in ice extent is - beyond reasonable argument - sharply downwards.
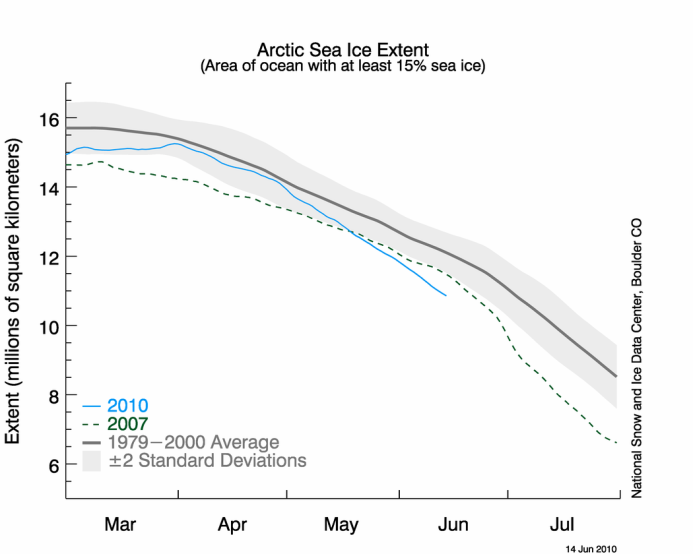
Image source: http://nsidc.org/arcticseaicenews/
Sea ice extent is a measurement of the area of ocean where there is
at least some sea ice.
NSIDC
If you add up the areas of all of the bits of ice in a sample area of sea you get a total of sea ice area, obviously. If that area of ice is less than the sea area over which it is spread then the percentage area of ice is the ice extent. Concentration is a term used by NSIDC to denote the percentage of ice in each 25km square surveyed.
It is vitally important to realise that the maps which NSIDC produces show - in white - areas gridded as 25km squares in which at least 25% of the area is ice-covered. Anyone wishing to demonstrate concentration over the entire Arctic would need to plot gridded data in various colors - not just white.
Because of the errors inherent in automatic data plotting, I prefer to look directly at satellite images. These have the advantage that, by comparing any two images of the same area at different times, or making an animation, ice mobility and quality can be directly observed.
Large floe enters Nares Strait - and breaks up.
June 03 to June 15 2010. MODIS images. 1 frame per day.
As can be seen, the ice is very mobile. As the floe comes to rest blocking the strait, it fragments in only one day, demonstrating its low quality, it's lack of strength.
By way of contrast, the ice bridge between Greenland and the small island to the left in the animation was of high quality. It persisted throughout the year until today. Its presence slowed the export of ice a little during a summer when every little is needed.
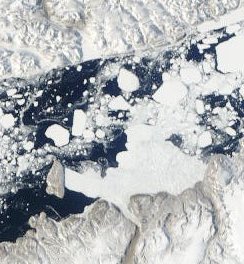
May 29 2010 - ice bridge between Greenland and Franklin Island.
From a NASA MODIS image.
Hans Island is just about visible, near the centre of the image in a notch of ice.
Ice mobility
Using a blink comparator method, or blink map, it is possible to estimate ice volume approximately from ice mobility. By the term mobility I mean particulate mobility. A mass of consolidated ice covering most of the Arctic basin may well be mobile in the sense that the whole mass moves. My use of the term mobility refers specifically to the ability of ice to flow as a particulate or granular material. Arctic sea ice is largely granular due to the way it forms and the way that brash and melange re-freeze in winter.
When young ice which bonds brash and floes together melts, the loose pack becomes more mobile. In summer, this mobility causes further ice break-up due to impacts. Persistent winds can cause ice to pile up under pressure, but variable winds more commonly cause collisions.
Ice break-up due to collisions is a positive feedback. The ice becomes ever more mobile. The more mobile ice is, the greater the chance of it being moved out of the Arctic Sea by winds or currents. Mobile ice is interspersed with water. It has a reduced albedo - a positive feedback to melting.
Along the edge of the pack ice is a zone known as the ice margin. This is the zone where ice can be affected by waves. Historically, this was the only place where the ice would be highly mobile. The ability of waves to move ice depends on the type of ice. Waves have little effect on heavily consolidated ice. Mobile ice, however, is affected greatly by waves.
Wave action can cause collisions between floes. Waves can erode floes directly and can wash over thinner floes. Ice melts much more rapidly from contact with water than from contact with air. The more mobile the ice is, the more it is affected by waves. The more it is affected by waves, the more mobile it becomes. This is another positive feedback.
As shown above, even a small island can obstruct the passage of floes - unless they are smaller than the island.
Ice quality
To a computer analyzing satellite data, ice is ice. Even if data is available to show ice thickness, computer analysis cannot so far use this data to extract information about quality.
Quality, as I use the term, is the resistance to impact and to melting of any continuous amount of sea ice. If part-melted brash refrozen in winter breaks into pieces in summer, that ice is of low quality. Just as a diamond can be split along a cleavage plane, so can ice be broken along a weakness - but much more readily.
All of the feedbacks operating in the Arctic come together so that refrozen brash is unlikely to survive long enough to be consolidated into the pack. Much of what counts as ice extent in winter is new ice formed on open water. New ice is prone to rapid melting in summer if not consolidated into the main pack.
In normal times, there was a margin of ice which might be considered a 'sacrificial protection' for the main pack. It would melt in summer and be replaced in winter, within close limits.
These are not normal times. Ice melts in the summer within a wider margin, and is not fully replaced in winter. The reason is that before the ice can be replaced, the heat gained by the Arctic waters in Summer must be lost. More heat takes more time to lose.
This, also, is a positive feedback.
Arctic summer warming
In the Arctic, sunshine and warm air first melt the snow cover on both ice and land. This absorbs so much heat that the surface temperature is barely affected. On land, as the snow melts, the land itself warms up. In the Arctic, the summer snow line is the line below which snow is found. Mountain peaks warm faster than the slopes. Land bordered by water tends to warm faster than land bordered by ice.
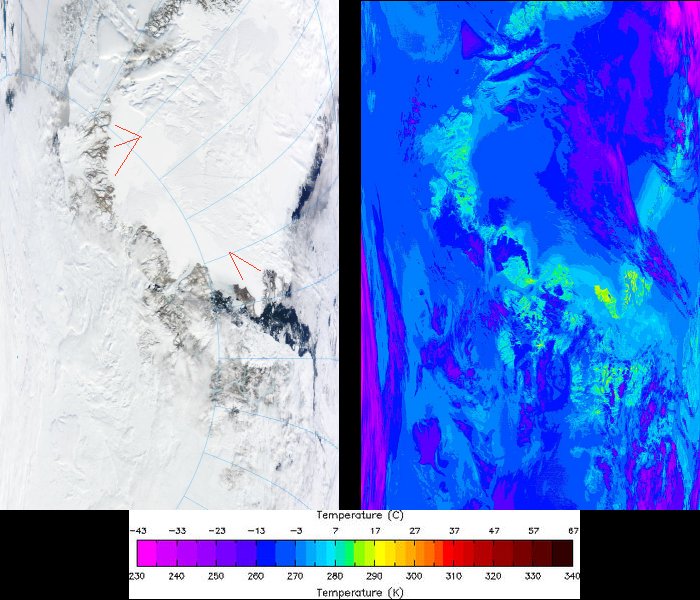
Summer land warming differences at similar latitudes.
From MODIS images for June 14 2010.
Red lines show the locations of main interest.
The sun cannot warm the sea if there is ice cover. Vast quantities of heat energy are absorbed in melting the ice before the sea temperature can begin to rise. Once there is open sea, the temperature can begin to rise. In regions of ice free coast, both land and sea can warm together.
Discussion:
Before average surface temperatures over the entire Arctic can rise significantly, a significant amount of sea ice must first melt.
This is currently happening.
Footnote
[1] - http://neven1.typepad.com/blog/2010/06/nares-strait-animation-part-1.htm...


Comments