

It is Spring, and with each passing day a greater area of Arctic sea ice has 24 hours of - albeit weak - sunshine every day. It is not surprising to see ice melting in these Lands Of The Midnight Sun. What is surprising to many is the current extent of ice, and rate of loss, compared with past records.
"Every school boy learns that at the two ends of the earth the year is composed of one day and one night of equal length, and the intervening periods of twilight; but the mere recital of that fact makes no real impression on his consciousness. "
Robert E. Peary - The North Pole - 1910
Studies of paleoclimate, together with our knowledge of the Earth's Dynamic Equilibrium and the dynamics of systems generally, suggest that the earth's overall climate is subject to extreme changes on geologically short time scales. The earth's climate system has always shown moderate fluctuations of average annual temperatures for long periods. From time to time, the range of annual temperatures shows a sudden and dramatic shift. It appears that if average global temperature shifts beyond some specific range, then the system reacts by accelerating the shift. The differences between climates either side of such a 'tipping point' can be extreme.
Extreme is a relative term. When an extreme of climate shift is extreme in human terms you can get climate anomalies ranging from desertification through to a little ice age. When the shift is on the geological scale, especially if it is completely or partially of geological origin, then 'extreme' means 'causing mass extinctions'. See for example: A Runaway Greenhouse Effect: Purple Bacteria.
A complete loss of Arctic sea ice could turn out to be be extreme on the human scale, manifesting as severe changes in average seasonal weather and in a sea- level rise of about half a meter. The sea level rise would be due to the expansion of ice cold water as it warms and to the increased rate of calving of glaciers in the Arctic region.
Has the Arctic sea ice reached a tipping point?
The global warming trend observed in direct measurements and a very wide range of proxy data since about 1860 has led many climate researchers to discuss the possibility that we humans are engineering a new tipping point through our profligate use of fossil fuels.
Of particular concern is the possibility that if the Arctic is ice free in summer, or if the Greenland ice sheet shrinks, or worse: both, then climate change may be inevitable and irreversible.
My purpose in writing this series of articles is to examine the question of whether or not we have already reached an Arctic climate tipping point this year, 2010.
Arctic sea ice 2010
I have been examining the MODIS satellite image records and checking on as much data as is available live to monitor the daily state of the Arctic sea ice. I have written about my own and other writers' views in a series of three articles, commencing with Arctic Ice 2010 #1 - The Nature Of Sea Ice.
In part #3 of that series I published a map showing my projections for ice melt 2010. Just for clarification, polar sea ice loss is due to various mechanisms. However, whether the ice melts or sublimates in situ or whether it travels south as floes or bergs and then melts is immaterial: it melts. It is important however for anyone looking at ice extent trends to realise that mass loss can be accelerated by winds and currents where they tend to drive the ice south, towards warmer sea, warmer air and warmer sunshine. It is not at all unusual for a comparatively large area to become ice-free in a single day if strong winds carry enough broken ice away.
The Arctic Triangle
I use the term 'Arctic Triangle' to describe the Arctic Sea area shown within red lines in the map below.
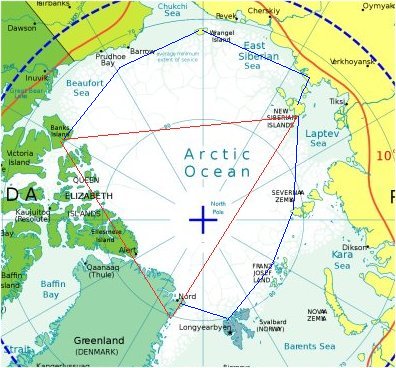
There is nothing magical or spooky about this triangle. Any three randomly chosen points on the globe will connect to form a triangle. The point about the area within this particular triangle is that it is an area within which heavily compacted, old, thick ice has been reported historically even in late summer. Within this zone, significantly large - greater than 500 meters - polynyas and open leads are expected to occur with an extremely low frequency. Smaller leads - up to about 10 meters have been reported with a fairly high frequency and have been considered normal.
The blue lines show an area appended to the triangle within which ice extent has, until recent decades, tended to fluctuate greatly in location, whilst maintaining a fairly constant thickness and extent. Between the blue lines and the coast ice, thickness and extent has varied widely in summer extent in former times. Until recent decades only portions of those waters were at all navigable in summer.
Shorebound ice and ice shelves
An ice shelf is a fairly smooth expanse of sea ice which forms where glacial ice flows out onto the sea. Ice shelves1 may be many thousands of years old. Shorebound ice is sea ice which has been driven into or onto the shore and become relatively immobile. It may vary in ages from one or two seasons through decades.
If ice is severely cracked or broken nearer the shorebound ice, then the motion of that broken ice can erode the shorebound ice. This can lead to massive ice floes being free to move. Ice in linear motion, especially in winter, tends to compress together as a mass, by various processes. Ice which is moving randomly and rapidly, especially in spring and summer, tends to fragment more. As ice fragments it exposes a greater surface to direct contact with the sea. If the sea temperature is higher than freezing point then the fragmentation accelerates ice loss in situ.
Once the main ice cover has retreated from shore it is more vulnerable to erosion. Between the blue and red lines in the map, above, ice cover can vary locally in thickness and extent from year to year, whilst maintaining a fairly constant range of total area. However, as the ice extent reduces there is a feedback mechanism whereby more open sea leads to higher local average temperatures in the Arctic's summer of 24 hour days.
The red triangle on the map, the 'Arctic Triangle', is a zone within which ice has historically persisted on average as thick multi-year ice with substantial compression ridges and over-ridden chunks. Where the triangle is shorebound at Queen Elizabeth Islands, Ellesmere Island and Greenland it shows frequent seasonal inshore leads. Historically, these leads have been scattered, fairly unpredictable and of short duration. As far as I can discover through my researches there has been no time in recorded history when it was ever possible to circumnavigate Greenland, even in an icebreaker.
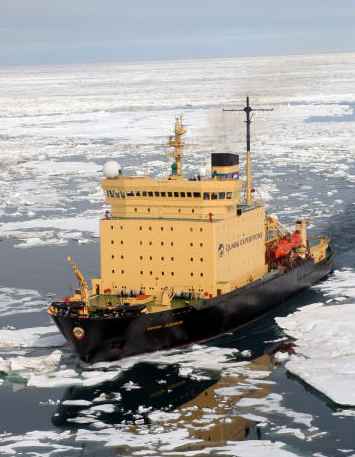
Icebreaker Kapitan Khlebnikov, picture by Roderick Eime, released to public domain.
I predict that this year, 2010, circumnavigation of Greenland will be possible for the first time. I will show in further parts of this series the satellite and other observations which lead me to that conclusion. I also suggest that the red triangle marks an area within which ice melt will accelerate more rapidly if retreat to that area occurs any time before September.
Arctic sea ice dispersion outlets
Ice can most readily flow away from the Arctic via the Barents Sea, the Fram Strait, the Bering Strait and the Nares Strait.
Fram Strait
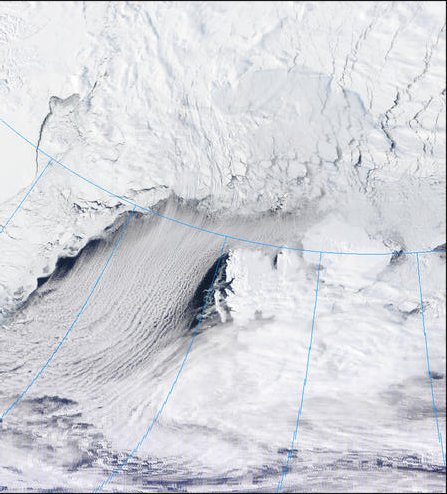
Ice smoke in the Fram Strait.
The Fram Strait, which lies between Svalbard and Greenland, provides an easy exit for ice driven by wind from the North. Apart from the Fram Strait, ice moving away from the pole has to negotiate various mazes of currents and islands.
Barents Sea
The Barents Sea extends from the coast of north Norway in the south to the Arctic Ocean in the north. It is bounded by Svalbard in the west and Novaya Zemlya in the east. The Barents Sea is comparatively shallow at an average 230 metres. In the Barents Sea, the cold water from the Arctic Ocean meets the warm Atlantic water that is being carried northwards by the Gulf Stream.
Bering Strait
The Bering Strait is South of the Arctic circle. Ice can be moved around by wind and currents, but until late Spring - early Summer, much of it remains trapped in an area bounded by the straits, with the Diomede Islands, St. Lawrence Island and the Aleutian Islands.
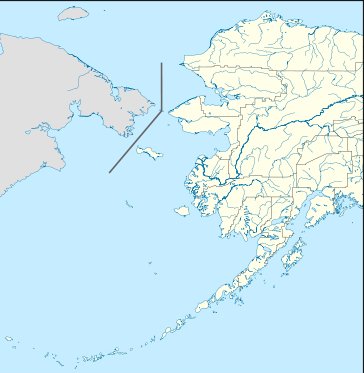
Bering Strait and Aleutians
Nares Strait
The Nares Strait tends to conduct ice south, but it is normally closed by an ice bridge at its southern end until perhaps as late as July-August. This year the ice bridge is at the northern end, is fractured and is already showing clear signs of disintegrating. There is a slow flow of ice into the north Baffin Bay area. However, Baffin Bay down to the Davis Strait is choked with ice. For as long as this 'plug' remains intact there is no exit south for the Nares Strait ice.
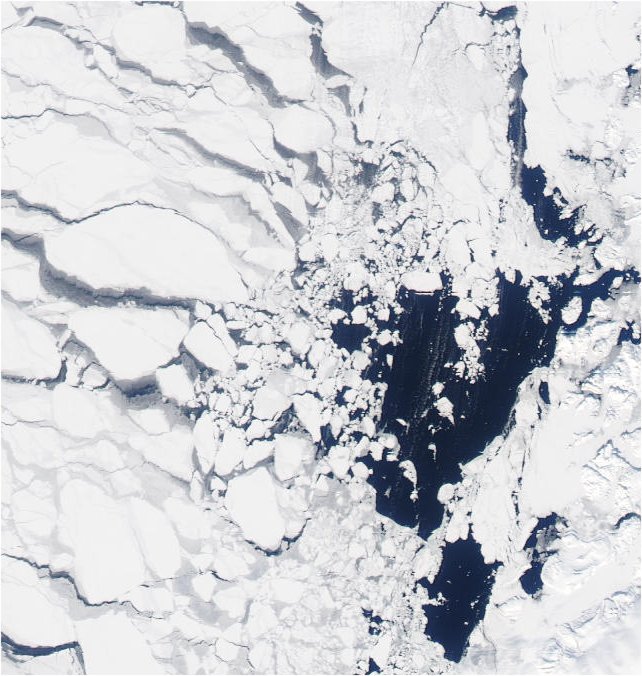
Ice in Baffin Bay, April 2010
-------------------------------
Historical background
In the series of three articles: Arctic Ice 2010, I gave some historical information from Robert E. Peary's book The North Pole - 1910 and from Fridtjof Nansen's book Furthest North.
From many web sources the record shows much the same picture: waters not usually navigable may become suddenly navigable for perhaps one year, but then subsequent explorers have failed to negotiate the same route shortly after.
From the time of WW2 onwards the Arctic became of strategic importance. Both the US and USSR made continual weather observations for mainly military purposes. Many of those records are now both declassified and available at no cost via the internet.
Those records show what was considered normal in the years when they were made. Here are some links to reports from the 1960s. They should be compared with more recent ice advance and retreat.
Some example papers from http://www.handle.net/
Historical written and graphic descriptions of expected ice conditions:
Long range ice outlook Eastern Arctic 1964
http://handle.dtic.mil/100.2/AD442309
Long range ice outlook Eastern Arctic 1966
http://handle.dtic.mil/100.2/AD633899
LOCAL ENVIRONMENTAL FACTORS AFFECTING ICE FORMATION IN SONDRE STROMFJORD, GREENLAND. James R Tapager NAVAL OCEANOGRAPHIC OFFICE NSTL STATION MS, 11/1955.
http://handle.dtic.mil/100.2/AD100162
--------------------------------------------------
To be continued ...
In the next part of 'Arctic Tipping Points' I had intended to show satellite pictures of the ice outlet areas, showing, where possible, a comparison of older images with the latest satellite images. This article has been deferred while cloud cover prevents me obtaining good recent pictures of the main areas of interest.
The next part instead is Arctic Tipping Points - #2: Some Feedback Mechanisms. It includes information about the Arctic ice shelves.
Footnote:
1 - within the past few years some Arctic ice shelves have collapsed. Being a lot smaller and less well known than the Antarctic ice shelves they did not attract much media attention. These shelves are featured in part #2 of this series.
------------------
Related:
Submission to the AWG-LCA by the Federated States of Micronesia.
http://unfccc.int/files/kyoto_protocol/application/pdf/micronesiabap0612...
Arctic Ice 2010 #1 - The Nature Of Sea Ice.
Arctic Ice 2010 #2 - What People Are Saying
Arctic Ice 2010 #3 - The State Of The Ice (as of Apr. 09 2010)


Comments