

This is part #4 of a brief explanation of the NASA/GSFC MODIS Rapid Response System - Rapidfire - together with a Howto for citizen scientists. The first part was
MODIS Rapidfire For Citizen Scientists - #1
In this part, I describe some of the things to be seen in the MODIS images.
Before I go further, let me reiterate that the MODIS images come from satellites which look 90 degrees down at the surface of a sphere. The world's best camera cannot avoid distortions. The MODIS satellite imaging systems are nowhere near being the world's best cameras. Now add in the distortion when you take a flat picture of a spherical surface and ... Well, you get the picture. And I get an excuse for another one of my atrocious puns.
When you look at an Arctic mosaic from MODIS, never forget that the mosaic is made up of a series of images, each of which is a valid overhead view of a particular area. But when the images are stitched together into a geometrically flat square, there is no way that you can wrap that square onto a schoolroom globe. What I am driving at is this: if you want to count ice pixels to compare one MODIS image with another MODIS image then there is no problem. But due to the complex geometric distortions in a MODIS image, it is not scientifically valid to compare a MODIS ice pixel count with a pixel count from a graphic from any other source.
Now please take a break from absorbing all this text. Have a good look at the following animation. The sequence runs in 5 day jumps from March 30 to July 03 2010. I would like you to focus firstly on two things: the way the ice retreats from the coast by cracking, and the way the snow retreats towards the pole.
Arctic mosaic March 30 to July 03 2010
The images are from Arctic.2010178.aqua.4km.jpg through
089;102;109;117;123;129;135;141;147;153;159;165;172; 178 to
http://rapidfire.sci.gsfc.nasa.gov/subsets/?mosaic=Arctic.2010184.terra.4km
As sub-Arctic Winter gives way to Spring, the days get longer until the sky stays light even after sunset. As you travel north, the days get to be 24 hours long, with the longest span of such days at the pole. You might expect snow to melt from the pole outwards, but remember that while the pole is still in darkness, the ever-longer days and ever-higher sun are warming the lower latitudes. That band of warmth spreads from south to north as a contracting circle.
The time taken for the snow cover to retreat completely depends mainly on average temperature and average snow depth. If you look at images from other years you will see that the areas where snow lingers longest are not always the same. This year, as you can see from the animation, snow cover has lingered longer in the Canadian archipelago than most other regions. That snow cover has delayed the melting of much ice in that region.
Albedo and feedback.
Understanding the concept of albedo will help you to understand the dynamics of the changes you see in MODIS images. Albedo is a number ranging from 1 for perfect reflectivity to 0 for perfect absorption. If you take a MODIS image and convert it to greyscale you get a very good approximation of Arctic albedo range.
It is fairly common knowledge nowadays that as high albedo ice is replaced by low albedo open water there is a feedback effect. What is less well known is that even before ice melts there are other albedo effects. A change in albedo isn't like throwing a switch.
Take a look again at the animation and notice how the main body of the Greenland ice cap stays white. That is extremely cold ice overlaid with very thick snow. It is the snow which is responsible for the high albedo, and the high albedo which helps to keep the interior of Greenland so cold. Around the edges, white gives way to grey as the snow melts to reveal moraine. Between the pure white and the grey you can often see a band of snow-free ice, often with meltwater pools.
The Arctic tundra changes from white, through brown, to green. Sometimes it changes to a darker green, or even back to brown. The albedo change is so great that in a generally warmer Arctic the temperature can climb high enough to dry out the plants. It only takes a lightning strike to ignite a tundra fire. The grey smoke is easily distinguishable from cloud.
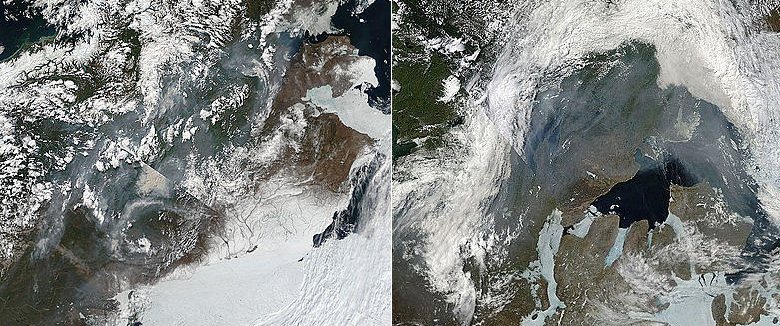
Smoke from tundra fires.
taken from Arctic.2010150.aqua.4km.jpg and Arctic.2010179.terra.4km.jpg
The albedo gradient
Albedo doesn't change in steps. It is continually variable between the cleanest, brightest snow and the darkest deep waters. As the line of warming advances over the ice it first melts snow. Snow contaminated by particulates such as soot will melt sooner, clean snow later. The meltwater will lay in lakes and puddles, further lowering albedo. Algae will grow in some water, further lowering albedo. Cracks in ice appear as grey in images because they can act as light traps. Cracked ice, even without leads, has a lower albedo. You can imagine the main ice cap as a roughly circular mass of ice having an albedo which, until all the snow is melted, has an albedo ranging from about 0.15 in places at the edge to about 0.9 at the pole.
Some notes on meltwaterThe Spring meltwater runs along many rivers into the Arctic ocean. As it flows along into the ocean it carries with it a lot of silt. If you think about it, it also carries a lot of heat. In general, if a river melts early you may expect its sea area of discharge to melt early.
Meltwater is often warm enough to trigger algal blooms. You can easily spot algal blooms as green or blue-green patches. These patches are a useful indicator of local temperatures and local currents.
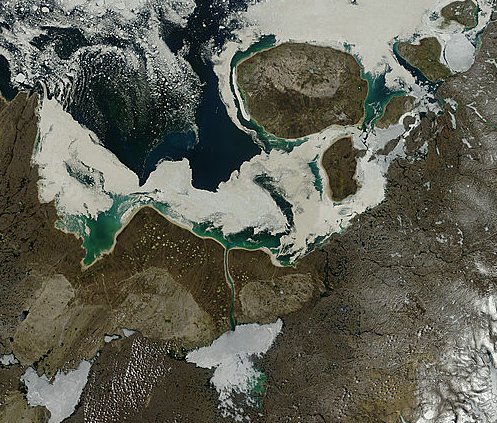
Blue and green algal blooms in Foxe Basin. image taken from:
http://rapidfire.sci.gsfc.nasa.gov/subsets/?subset=Arctic_r03c01.2010185...
Edit: link corrected to point to July 4th mosaic.
Note how the thick shorefast ice can persist long after the sea ice has retreated from the shore. This brings us back to my point about how sea ice retreats from shore by first cracking. During the winter, enormous pressures force ice onto the shore. The force is so great that the ice will often push soil and shingle ahead of it in heaps. The ice stops moving onshore only when the backpressure from friction equals the thrust from seaward. At that point the ice piles up in huge ridges. The thinner sea ice rises and falls with every tide, opening cracks.
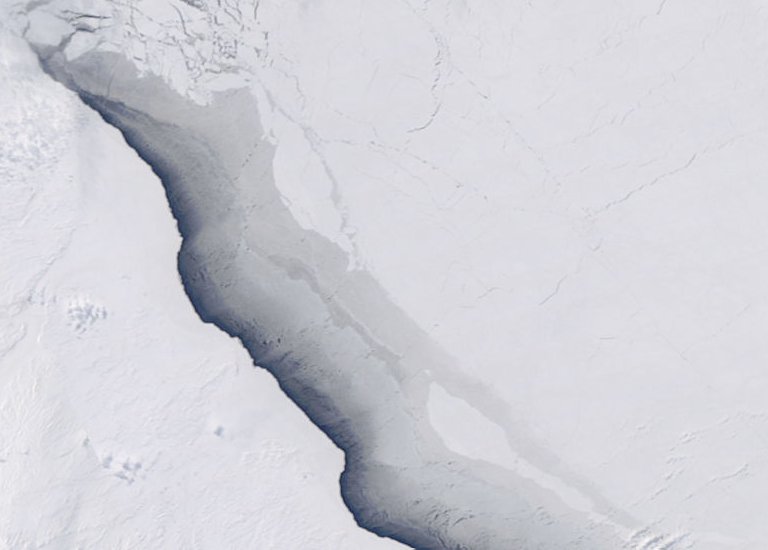
A lead with, from left to right, open water and ice of varying thickness. March 30 2010, from:
http://rapidfire.sci.gsfc.nasa.gov/subsets/?subset=Arctic_r05c02.2010089...
In winter these leads will usually fill rapidly with new ice. Ice motion causes water to slop over the top of the ice, which can help thicken the ice. Once the air and water temperatures are high enough to keep a lead from freezing over as soon as it forms, the water in the open lead begins to warm up. Any warm water slopping over the ice hastens melting. Slowly but inexorably the lead widens. As it widens it warms and as it warms it widens.
As the ice retreats from land it will often leave behind huge masses of shorefast ice. These masses affect local conditions and local livelihoods. But any effect they have on Arctic albedo as a whole is entirely trivial.
Never forget that the main pack is in constant motion as a whole. Within the pack there have always been leads and polynyas which form and vanish summer and winter alike. What we are seeing now is, I firmly believe, a pack so granular and mobile that it can no longer be assumed to have a fairly even distribution of albedo from edge to center.
In a warming Arctic, ice once made granular and mobile appears not to be compressed back into consolidated ice as it follows the Beaufort Gyre and Transpolar Drift. Thus, the high albedo of the main pack is not maintained. Pack ice melt is no longer restricted to the edges. Melt can progress from within the main pack in any area of relatively low albedo.
Now that you know how to get detailed images and study them you are well placed to see daily changes in the Arctic for yourself.
Never let anyone tell you what their pet theory tells them ought to be true in the Arctic.
Never let anyone do your thinking for you.
And yes: that includes me. :-)
------------------------------------------------------------------------------------------
Further reading:
You can find many more articles about ice, the Arctic and - occasionally - the Antarctic in my blog:
http://www.science20.com/chatter_box/
Some recent articles which may be of interest:
Understanding Ice
Arctic Ice July 2010
Arctic Tipping Points - a series of 7 articles.
-----------------------------
Tip of the hat to Neven for collecting many useful links together.
http://neven1.typepad.com/blog/
Daily graphs and maps:
http://sites.google.com/site/arcticseaicegraphs/
Interesting websites:
http://neven1.typepad.com/blog/2010/06/interesting-websites-for-watching...
-----------------------------------------------
Further materials for study:
http://www.arcticice.org/albedos.htm
http://www.ucsusa.org/global_warming/science_and_impacts/impacts/arctic-...
http://www.cesm.ucar.edu/models/atm-cam/docs/description/node35.html
http://www.pnas.org/content/101/2/423.long
http://www.agu.org/pubs/crossref/1986/GL013i009p00945.shtml
Related:
An article from a rare book which I have uploaded -
Search For Franklin - A Free Resource


Comments