

By the way - when I write an asterisk W* after a particle, this means that the particle is "off-mass-shell" -that is, it is produced with a mass significantly different from the one it should have. So, for the Higgs (a 125 GeV object) to decay into two W bosons, which collectively have 160.7 GeV of mass if produced on mass shell, one of the W must be marked W*.
So, neutrinos make the H->WW* decay less striking - but cunning experimental techniques are overcoming that problem, as we will see below in the graph I am calling "plot of the week" today.
Neutrinos are not necessarily a result of W decay - the W in fact decays 67% of the time to a quark-antiquark pair (quarks of different flavour), with no neutrinos involved. Unfortunately, when this happens it is much harder to distinguish the W decay from QCD background events that have nothing to do with Higgs production. Given the very small cross section of Higgs production, using W->jet jet signatures is very, very tough.
ATLAS (like CMS) looked at events with two energetic leptons (electrons and muons) and large missing transverse energy, the latter indeed produced by the escaping neutrinos. The ATLAS analysis is very complex as it distinguishes events with zero, one, and two jets, and further divides two-jet events into gluon-gluon-initiated and vector-boson-fusion-initiated processes. I believe it is better to spare you of similar details, as you can read them in the article now posted on the arxiv.
The critical point in a search for a small signal is the detailed understanding of backgrounds. The ATLAS analysis does this by examining a number of control regions devoid of signal contamination, where the various background processes contribute in different way. The good matching of observed data and predicted backgrounds in all these control regions is a guarantee that in the signal-enriched regions any excess behaving like a Higgs contribution can safely be assumed to be such.
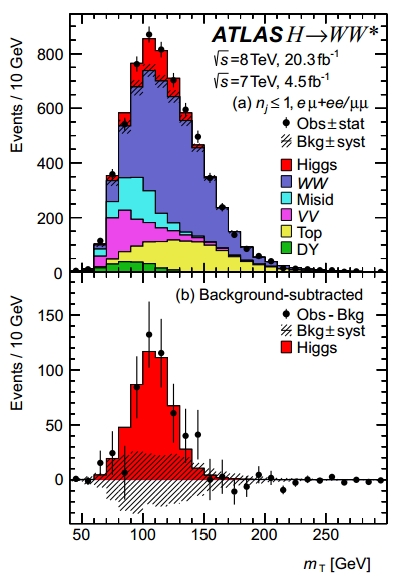
The graph below shows the "transverse mass" distribution in all the 0- and 1-jet combined search regions, after optimized selections. The top graph shows the sum of all backgrounds and Higgs signal (red), the bottom one shows the background-subtracted distribution of the data (black points) and fitted Higgs signal (red). The signal is quite large and amounts to several hundred events!
While we wait for the LHC to resume operations and start collecting data at 13 TeV - when the Higgs production cross section will be more than twice as high - this is a very nice appetizer: these Higgs bosons will be used in the next few years for precision measurements of the properties of the particle - of which we assume we know everything from Standard Model predictions, but which could hide many a surprise in its detailed phenomenology. So, the message is: stay tuned for next years' data and results!


Comments