

The sun is the main driver of climate and weather. The Arctic solar year could be plotted as a graph of the angle of the sun relative to the horizon, negative in winter and positive in summer. The graph would be a very neat waveform which varied little in amplitude or in frequency on decadal timescales. By way of contrast, any graph of any effect of the sun's relative angle will vary from year to year. Although the sun will warm the air, land, sea, snow and ice, it will never do so in exactly the same way during any two years.
In order for any climate or weather pattern to repeat itself in timing or scale, every micro-component of the climate system must behave in exactly the same way during one year that it did in a previous year. That can never happen. The reasons why it can't happen are to be found in astronomy and mathematics.
Our planet's orbit imposes a periodicity on the sun's direct influence on climate, but the various components of the climate system each have their own inertia and each has an element of chaos in its behavior. The result of these elements of chaos and inertia is that the climate is only broadly periodic. The climate system exhibits a sensitive dependency on specific ranges of conditions and will change substantially if any one or more of those ranges is changed.
Fortunately, although our planet's climate system is not perfectly periodic, it is nearly so. This means that the unpredictability is constrained within limits. Those limits are set by the physical attributes of the system. If any attribute is changed by a sufficient amount, the limits of the system will change. When the climate system moves outside its previous limits it tends to become more chaotic. The system will still be subject to any controlling conditions which remain unchanged, but will be pulled towards new conditions. For a time the system will fluctuate between wider limits than before, and then it will enter a new regime with new limits.
It is fundamental to planetary physics that no body in space can ever repeat its trajectory exactly. Although the paths of astronomical bodies are broadly dictated by the physical laws of gravitational systems, the location and velocity of any body at a particular future time cannot be calculated precisely. As bodies move in response to gravitational attractions, any small perturbation can affect future states. Minor and seemingly random perturbations can never be predicted without perfect knowledge of every tiniest component in a system. Since we can never have perfect knowledge, all we can do is to show regions in space within which a celestial object will almost certainly be found at some future time.
Butterflies and chaos
In 1952, the science fiction writer Ray Bradbury published a short story: A Sound of Thunder. It is a story of time travel in which a butterfly has a major role. It was the mathematician and meteorologist Edward Norton Lorenz, a pioneer of chaos theory, who popularized the idea that a mere butterfly could affect weather1. The term 'butterfly effect' is now part of our culture. Lorenz showed that planetary atmospheres exhibit quasi-periodic behaviors which, although fully deterministic, are not predictable beyond a small range.
Many physical systems can be described in broad terms by simple mathematical models, but their long term behavior is highly sensitive to initial conditions. Given that our planet's orbit is such a system, that our atmosphere is such a system, that our oceans form such a system and that the ice-albedo interaction may be described as such a system it is surprising indeed that we can forecast both weather and climate with the degree of precision required by risk takers2.
Arctic chaos
Although the earth's annual orbit is never the same twice, nevertheless a plot of superimposed yearly graphs of sun angle for any latitude will be almost a single plot, almost a single sine wave. However, a plot of superimposed annual measures of any effect caused in that latitude by solar heating will show the wide variations in effect which arise from atmospheric and oceanic circulation and from many other causes. The graph below shows this variability quite plainly.
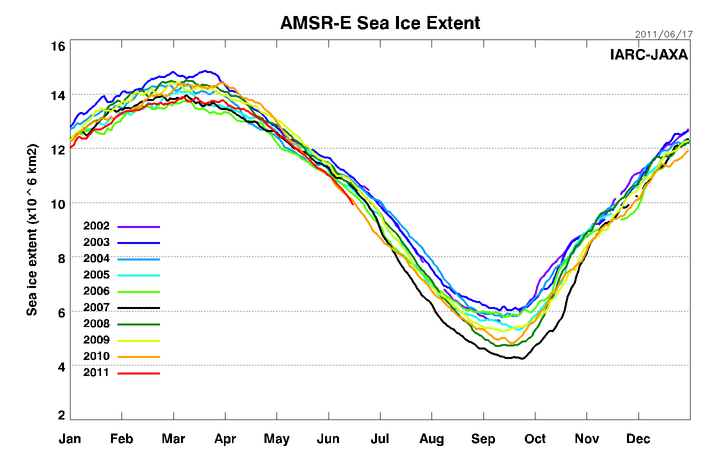
IJIS AMSR-E sea ice extent, June 17 2011
source:
The IJIS graphs of ice extent are plotted on an x axis which represents the orbital year, but that is an arbitrary choice of 'signal lock'. If we would align the graphs so as to superimpose all maxima, or all minima, or all crossings through some arbitrary level, then we would see quite clearly that the wavelength and amplitude both fluctuate. Sine waves of a fixed frequency would all cross each other at two common points, regardless of amplitude, as in the graph below.

The effect of inertia in the components of the Arctic climate system is to vary the frequency - the exact time between maximum and minimum ice extent. The bunching together of the IJIS extent plots in two places - May and November - corresponds to that variation in frequency. The variation in frequency is of interest. The bunching is of no significance in itself: it is merely a displacement of what would be zero crossings in plots of pure sine waves having a common frequency but a varying amplitude.
Overlaying annual graphs helps to show the range within which one might expect to find future ice extent on any given day. However, a superimposed graph does not help much in seeking out evidence of Arctic regime change. Chaos theory3 suggests that if the Arctic is undergoing a regime change then we shall see evidence of this, as a stable regime transitions through wild swings to a new kind of stability. An examination of Arctic ice anomalies from 1979 to 2011 shows - I suggest - evidence of such regime change.

Ice extent anomalies 1979 - 2011
full size image available from source: The Cryosphere Today
The Cryosphere Today graph of ice anomalies is based on the 1979 to 2008 mean. The overall trend is obviously downward with respect to that baseline. There is also - I suggest - another trend: a trend towards instability. From 1979 to 2006 inclusive, each annual anomaly range spans close to 1 million km2, apart from 1996 when the range was closer to 2 million km2. In 2007 and in each year since, the range has been wider - close to 2 million km2. This sudden and continued change from average behavior suggests to me that the Arctic is now passing through a period of regime change. If that is true, then the annual melt pattern for 2011 onwards will resemble the patterns of 2007 through 2010, or else the melt will be more extreme.
The Arctic ice extent is currently the lowest ever for this date - June 18 2011. If the current trend continues then the September minimum could easily be lower than in 2010. There are strong indications that the current trend will continue.
Arctic climate regime change
The geographical annual and diurnal ranges of temperature would be partly smoothed away, if the quantity of carbonic acid was augmented.Arrhenius was writing about snow cover, not the Arctic. However, his idea of ice-albedo dominance over CO2 effects would seem to be sound. Until, that is, the accumulating effects of rising CO2 reduce Arctic winter ice and snow growth to a level below that required for climatic stability. The continued annual reduction in the Arctic's albedo and thermal mass must lead to a time when it is the effects of atmospheric CO2, rather than albedo, which dominate the Arctic climate system. That would be a new regime in which the annual temperature range of the Arctic would be less than historic norms.
...
But ... I incline to think that the secondary action due to the regress or the progress of the snow covering would play the most important role.
On The Influence of Carbonic Acid in the Air upon the Temperature of the Ground.
Svante Arrhenius, April 1896
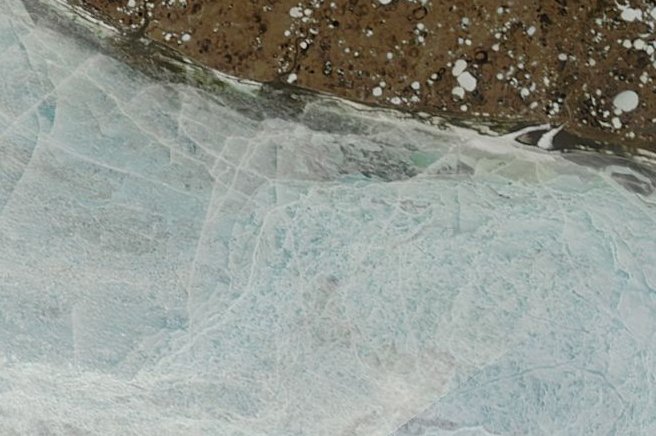
In passing from a regime dominated by ice-albedo effects to a regime dominated by the effects of increasing atmospheric CO2, the dynamical system must pass through a chaotic regime. I suggest that we are witnessing that regime. Although this year, 2011, saw prolonged low air temperatures in the western Arctic, that has not retarded ice retreat substantially as compared with 2010. The ice in the Canadian Archipelago, although of slightly greater extent than at this time in 2010, is covered in meltwater pools and is breaking up rapidly.

Canadian Archipelago June 18 2011
The ice bridge in Nares Strait was much more robust than last year and lasted much longer. At this time last year, ice was passing from Lincoln Sea through Nares Strait. The strait is still blocked at this time, but the ice bridge has collapsed, so the Strait should be a conduit for ice by July. As an indirect effect, I suggest, of ice transport through Fram Strait, Nares Strait and the Canadian Archipelago, the main pack is relieved of some pressure. This would allow the pack to spread out more, with consequent enhanced melting.
Both the NWP and the Eastern passages will almost certainly be as freely navigable this year as they were last year. Along the Siberian coast, the only ice still largely attached to land is very thin, covered in meltwater pools and in process of breaking up.
Ice on the Siberian coast
Much depends on the Arctic weather, but it looks likely that the September ice minimum will be amongst the three lowest. If the melt in July and August proceeds as it has done on average over the last decade, then the 2007 record minimum may well be beaten.
-------------------------------------------------------------
Footnotes:
[1] - Edward Norton Lorenz,
Does the Flap of a Butterfly's Wings in Brazil Set Off a Tornado in Texas?
eapsweb.mit.edu/research/Lorenz/Butterfly_1972.pdf
[2] - risk takers: people who require accurate information about future weather and climate in order to minimise the risk of some form of loss and/or to maximise the chance of some form of gain.
[3] - for an excellent introduction to chaos theory, I recommend the book Chaos: Making a New Science, by James Gleick.


Comments