


The nighttime satellite photos of the Earth reveal much about the population distribution of the developed world through the intensity of the artificial lighting being observed. In the map of the eastern half of the U.S., some population patterns can be easily seen, such as the linear set of northeastern cities from Boston to Washington DC; a ring of cities surrounding the Appalachian mountains, and the north-south line from Dallas separating the eastern temperate prairie and western semi-arid great plains.

Image of the lights at night over the eastern U.S. with a light green line around the Appalachian and a darker green line outlining the cities surrounding the Corn Belt .
http://www.npr.org/sections/krulwich/2013/01/16/169511949/a-mysterious-patch-of-light-shows-up-in-the-north-dakota-dark
But I think there is another pattern, the seeming parabola of cities surrounding the corn belt. The furthest east vertex seems to be Pittsburgh. The top half goes near Cleveland, Detroit, Milwaukee, Madison, and Minneapolis. The bottom part goes below Columbus to Cincinnati, between Louisville and Indianapolis, onto Saint Louis, and Kansas City. In the middle of the area is the largest city of the Midwest- Chicago.
This area is known by a few names such as the corn belt, the tall-grass prairie, and the Midwest. One factor of its shape is the very fertile black soil that was deposited by the glaciers. That along with the temperature and climate formed by the Mississippi watershed and the Gulf of Mexico to the south, made this an ideal place to grow corn (along with soybeans). This can be seen the USDA corn production map below.

The agricultural productivity of this area was highlighted by the recent maps generated from the GOME satellite which could dig the photosynthetic fluorescence signal during plant growth from the larger signals of reflected light and thermal radiation. The video from NASA with the same data for the rest of the world can be found at: https://www.nasa.gov/content/goddard/seeing-photosynthesis-from-space-nasa-scientists-use-satellites-to-measure-plant-health/
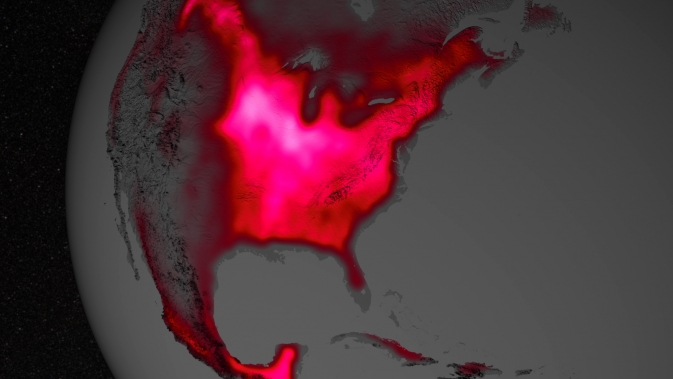
https://www.nasa.gov/press/goddard/2014/march/satellite-shows-high-productivity-from-us-corn-belt/
But how will the conditions change under potential climate change. Some have modeled this and predicted the change in the productivity due to changing temperature and precipitation. Their scenario predicts much lower productivity: a decrease of up to 10% in the next decade and a decrease of up to 85% by the end of the century :
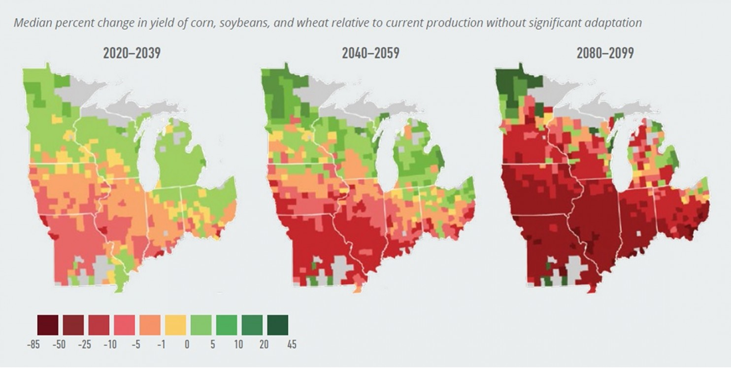
http://rhg.com/wp-content/uploads/2014/10/AmericanClimateProspectus_v1.2.pdf
Most corn raised in this area is not for direct human consumption but to raise cattle, hogs, and chickens. It is amazing how much more productive this land has become in the roughly 175 years that it has been tilled. Some argue that the productivity still has a ways to continue while others argue that the energy inputs and intensive demands on soils are not sustainable. At least now we have some more tools to monitor and model this important agricultural land and the cities that surround and depend on it.


Comments