

Correlation -in its most used version, due to Pearson- is a measure of how two quantities can be observed to be in linear dependence on one another. It is a very common quantity to report the results of scientific studies, particularly but not exclusively in the social sciences. Researchers try to evidence the presence of a correlation between two phenomena as a preliminary step to investigating whether one can be the cause of the other.
There is of course nothing wrong in measuring correlation. The problem is of course when interpreting the results. If I see a tight correlation between chocolate consumption in a country and its rate of Nobel prize recipients, should I conclude that eating chocolate makes one smarter ? Or should I rather conclude that winning a Nobel prize makes one eat more chocolate ?
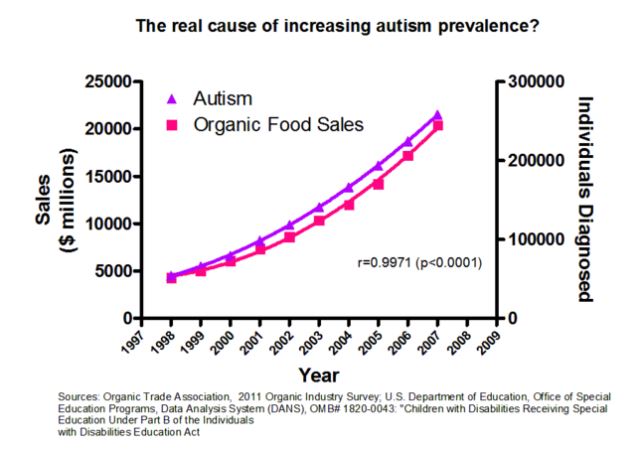
Puns aside, the distinction between correlation and causation should be clear to anybody reading this blog. For instance those arguing that vaccines cause autism on the basis of vague correlation measurements should have a look at the graph above (courtesy Hank's Facebook account) which would have them conclude that organic foods are rather the cause of autism! (But others might conclude that it is parents of autistic children who buy all the organic foods...)
So, the point about correlation and causation is clear. But there is another point to make which I think is not always clear to everybody. The absence of correlation between two variables is a much weaker condition than their independence. We often use "uncorrelated" as a synonim and substitute of "independent", but this is completely wrong from a mathematical standpoint! Two uncorrelated variables may in fact be completely dependent one of the other!
Wikipedia has a nice figure to illustrate the point. It is shown below.
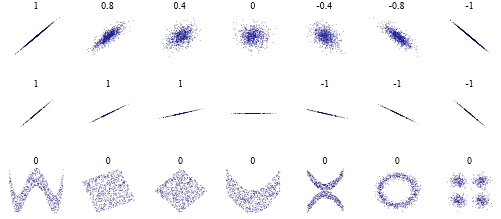
As you can see from the bottom set of graphs, you can have many different interdependence patterns between two variables with a zero correlation coefficient. But what the graph does not show is that you can even have an exact functional dependence between two variables (e.g. meaning, in the case of organic foods and autism, that if you told me the sales in $ of organic foods I could tell you exactly how many cases of autism are diagnosed that year) and still get a zero correlation coefficient!
Such is for instance the case of y=x^2, when x is in [-1,1]. This is a perfect parabolic relationship, and sets of points drawn at random from the curve will have a correlation coefficient compatible with zero (in the ensemble sense that you will find x% of sets with zero correlation at confidence level x%).
This means that, while you must be careful about concluding that there is some cause-effect relationship between two observable quantities based on their correlation, you must be even more careful when attempting to conclude that there is independence of the two from the absence of a significant correlation between them!
Please remember this often overlooked fact!


Comments