

So yesterday a new paper appeared on the Cornell arxiv, which is (should be) the final final word on the Higgs boson from 2-TeV proton-antiproton collisions data collected in Run II at the Tevatron. Titled nonchalantly "Higgs Boson Studies at the Tevatron", and signed by 900 CDF and DZERO members, it has a more aggressive abstract, which clarifies that the result includes all thinkable production modes and all meaningful final states. In particular, it says:
"We observe a significant excess of events in the mass range between 115 and 140 GeV. The local significance corresponds to 3.1 standard deviations at 125 GeV, consistent with the mass of the Higgs boson observed at the LHC".
The paper is longish, and I won't describe the many details here, but rather give an overview of the most interesting summary graphs it contains. But first, just a little background information for total outsiders -ones who have been sleeping in the last year and a half, or have been confined in a cave: it is really hard to find somebody who does not know about the Higgs boson these days!
The Higgs Boson, The Collider, The Experiments: Crash Course On A Particle Race For The Distracted
The Higgs boson is an elementary particle predicted 50 years ago (!) by a few theoretical physicists who introduced it in a still nebulous theoretical framework to reconcile the apparent large mass of the particle responsible for weak interactions -the one causing radioactive decays of nuclei and fostering nuclear fusion processes in the core of stars- with the resulting inconsistency of the theoretical calculations. Back then, it was a mathematical stratagem, but as the theory became more solid and precise in the seventies, the Higgs boson became a credible entity. The problem of the theory, though, was that it could not predict the value of the most important characteristic of the Higgs particle: its mass, which determines the rate at which it is produced and the phenomenology of its possible decay signatures into less exotic, detectable particles.
Since then, physicists have sought its trace in particle reactions of higher and higher energy at collider facilities around the world. A Higgs boson can be produced if an electron and a positron are made to collide at an energy large enough; this was what the LEP, and then LEP II, colliders at CERN attempted in the nineties and until 2002; yet the four experiments looking at these collisions found no trace of the elusive particle, and could only say that if such a particle existed it had to have a mass above 115 GeV.
In the meantime the Tevatron synchrotron in Batavia, IL tried to produce and detect Higgs bosons in proton-antiproton collisions with the CDF and DZERO detectors, at a higher energy but with much more complex particle reactions. From the 1988-1996 data taking phase these experiments found no hint either, nor could they further limit the mass range where the particle might be hiding.
More energetic collisions were needed for the signal of the Higgs production to emerge. The LHC collider, and the two large experiments built to study its high energy collisions, ATLAS and CMS, were built primarily with that goal in mind. But since 2002, while the LHC was slowly coming together, the Tevatron experiments collected a large amount of data, trying to obtain a first evidence of the Higgs boson existence before the bigger european brother could give a definitive answer.
The final word came from ATLAS and CMS last July 4th, when the experiments announced the discovery of a particle with the expected characteristics, with a mass of 125 GeV. Just two days earlier, joining their forces, CDF and DZERO had managed to throw in the information they could gather from their searches: they saw tantalizing hints of the existence of the boson, but could not claim an evidence of the kind required the scientific standards of the field - the so-called "three-sigma" level of significance of a signal.
Now that the particle is being studied with more care at the LHC, the Tevatron experiments also had time to re-analyze and improve their studies. So finally, with all the acquired data and all final states thrown in, they can reach above the "three-sigma" evidence level. This result is thus not so important for Higgs physics as it is as a demonstration of the capabilities of the good-old Tevatron collider, a machine which produced the top quark discovery in 1995 and a wealth of other advancements in the field of particle physics, and one which, had the LHC project failed to materialize, could have eventually discovered the Higgs boson by itself, in a foreseen but not realized upgrade to collect larger statistics.
The Results
The figure below shows a nice summary of all the data collected by the experiments in the various final states, ordered by the value of signal-to-noise (the variable on the x axis). As you can see, in each bin (which has a definite value of expected signal fraction) the light-blue background is dominant and the red signal component is undetectable until we go to the rightmost bins, which have an expected signal fraction large enough to make a difference.
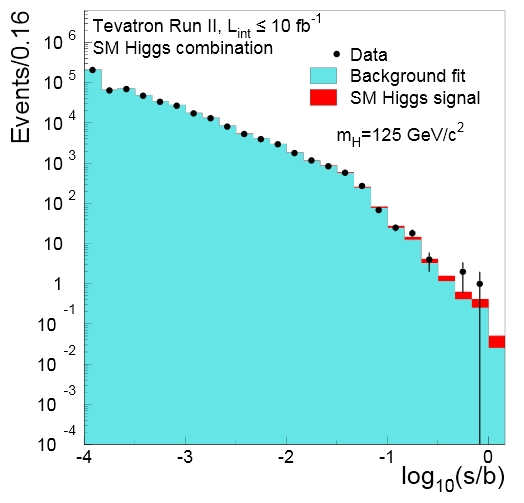
One important thing to note is that this graph is only one in a series, since it refers to a specific hypothesis for the Higgs boson mass: as the Higgs mass varies, so varies its production rate and its rate of decay to different final states. The mass assumed here is 125 GeV, the value measured by the LHC experiments.
This graph hides out all the beautiful technicalities and ingenuous experimental methods which extracted signal-rich samples from the trillions of proton-antiproton collisions, ordered them in different possible signatures of the Higgs boson decay, and squeezed out statistical estimators capable of evidencing a signal component. All of that is extremely interesting but at the end of the day what we care to see is whether the data (black points) follow better the blue histogram alone (background-only hypothesis, or "null hypothesis") or agree more with the blue+red histogram (which is the signal hypothesis, also called "alternate hypothesis"). You can judge by yourself: the few points to the far right do appear to be a bit above the blue histogram, although one needs a statistical analysis to extract an answer on whether that is significant or not.
So one studies the matter in the context of hypothesis testing, and comes up with another graph (see below), one which does not assume a specific mass but rather plots the level of agreement of the data with the null or alternate hypothesis as a function of the unknown mass of the Higgs particle. On the vertical axis you have the value of the statistical estimator which discriminates the two, the so-called "log-likelihood ratio" of the two hypotheses. The dashed black curve shows what one would expect to measure if the null hypothesis were valid for all Higgs masses; the dashed red curve shows what one would expect if the alternate hypothesis were valid instead.
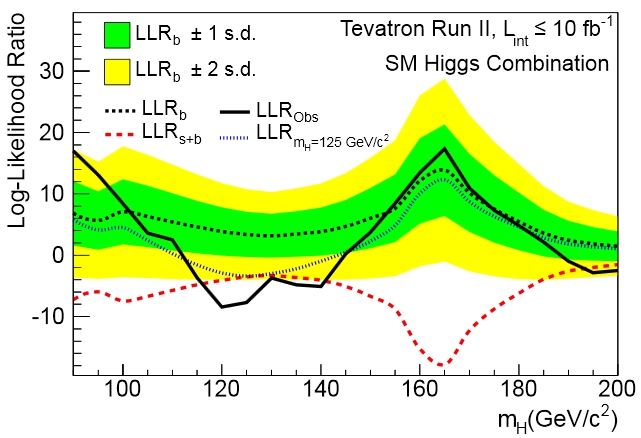
Note that one would NOT expect to see the data in agreement with the red dashed curve anyway: if the alternate hypothesis were true one would rather expect the data to follow the black dashed curve anywhere except in the surrounding of the true Higgs mass, where it would depart from the black curve and "visit" the red one for a small mass range. This is what the blue dashed curve shows: for a 125 GeV Higgs present in Tevatron data, one would expect the log-likelihood ratio to roughly follow that trend. You see in fact that the blue line starts off coincident with the black one for masses well below 125 GeV, reaches out to the red curve at 125, and then goes back to the black one for much higher Higgs mass hypotheses. And the full black line, which describes what is actually observed in the data, nicely follows that trend.
So the LLR plot says that the Tevatron data does match the alternate hypothesis for a Higgs mass of 125 GeV. But how significant is this departure ? This is shown in the graph below, which plots on the y axis the p-value of the null hypothesis, as a function of the hypothesized mass. For a mass hypothesis of 125 GeV one sees that the p-value goes to values of about 0.001, which corresponds to 3.1 standard deviations: this is what we call "evidence" of a new effect in the data.
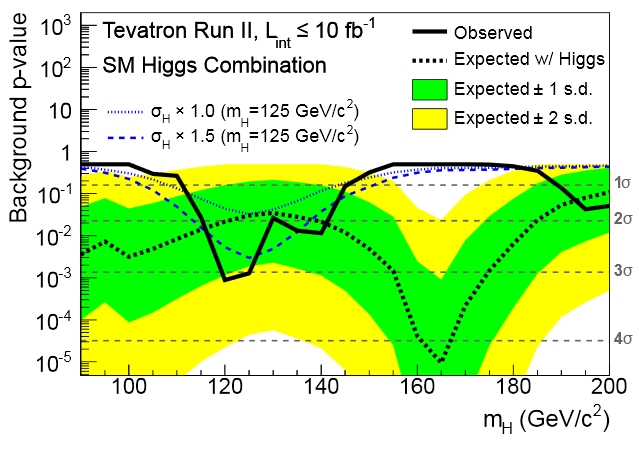
Note that this graph is rather confusing. It contains way too much information, since it wants to describe the expected situation for a 125 GeV boson (blue curves, of different width depending on the assumed production rate of the Higgs particle) and the general p-value that the experiments would expect to obtain for all Higgs masses (black dashed curve). I would advise you to just ignore the black dashed curve and its surrounding "one- and two-sigma" brazil band.
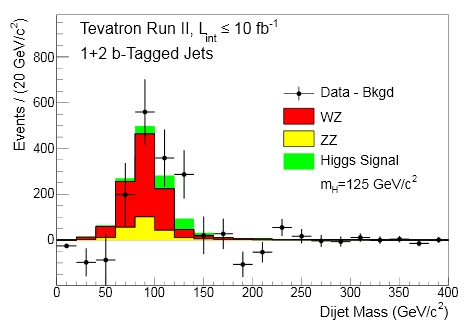 Finally, one nice graph (see right) shows the result of Higgs boson mass searches in the decay involving the production of two b-quark jets. In this case the process goes by the name of "associated WH/ZH production": a off-shell W or Z boson "radiates off" a Higgs boson, and then both decay, the W or Z yielding a lepton pair (which can be triggered and reconstructed easily and with relatively few backgrounds). So the signature is the signal of a W or Z boson accompanying the two b-quarks, and the combined mass of the two b-jets is the variable that is reconstructed.
 Since, together with other backgrounds, one would expect to see a signal of associated WZ and ZZ production - with one Z boson decaying to the same b-jet pair, but with a resulting mass of about 90 GeV- one can plot the "excess" data over all other backgrounds excluding the WW/WZ signal, and thus obtain a nice signal of that known, but rare, standard model process: WZ, in red, and ZZ, in yellow.
An excess of WH or ZH production events would then be observed as a departure of the data from the WW/WZ expected histogram, for reconstructed bb masses of about 125 GeV. That is indeed what one sees, from the two high points in that ballpark. This is indeed a nice direct observation of a Higgs signal! Note, however, that the excess in the data cannot be interpreted as due to the Higgs boson alone here: the excess is much larger than the predicted Higgs boson contribution (green histogram), so one must assume that it is largely due to background fluctuations (the background here is large, but has been subtracted off to show the diboson signals).
All in all this paper is worth giving a close look if you are interested in Higgs boson physics. The message to take away, however -and here I believe I am interpreting the secret wishes of my ex-Tevatron collaborators- is not what the Higgs production rate or properties are, but rather that the CDF and DZERO experiments ended their illustrious two-decades-long career with a proof that they, too, could see the Higgs!


Comments