Despite that, blogs around have raised expectations on the possibility that the Higgs boson might be spotted at less-than-observation-level significances in the whereabouts of 125 GeV. I say this without fear of being crucified by my LHC colleagues, since the discussion has been raging on many high-traffic sites for a while.
One way to look at it, while we wait for December 13th, is to go back to the results produced by the good-old Tevatron experiments this summer. This is entirely independent information, so it gives us some extra discrimination power, so to speak, on where the Higgs might be hiding.
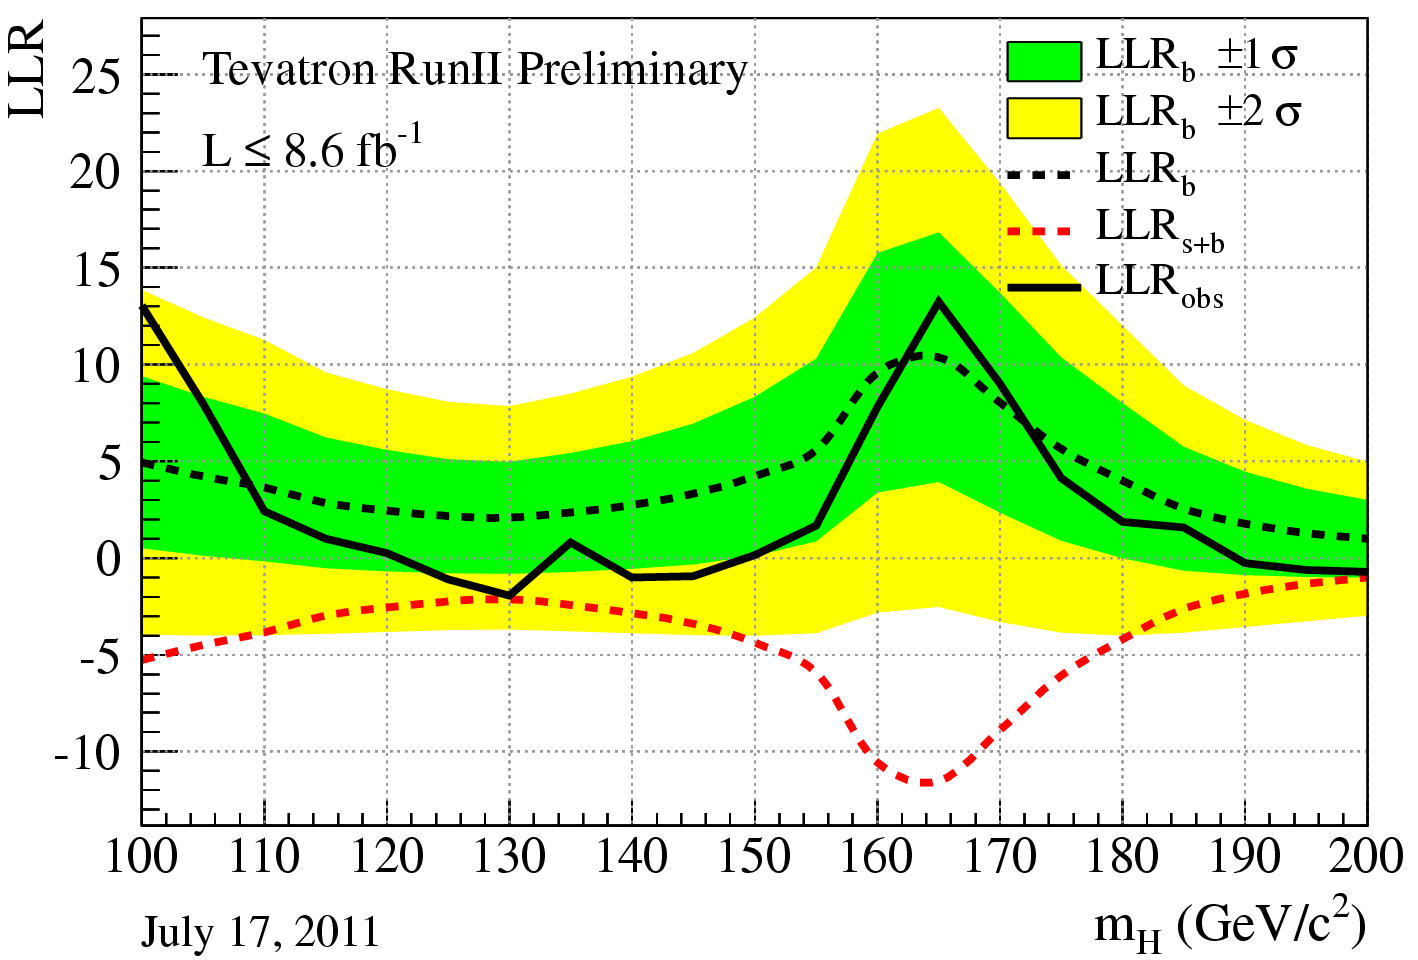
So let us give back a look at this plot:

In it, you see how a particular statistic (the log-likelihood ratio LLR) extracted from the combined CDF+DZERO data (black curve) distributes along the Higgs mass hypotheses. This statistic allows to discriminate the no-Higgs from the yes-Higgs hypotheses as powerfully as any other. The red dashed curve shows the value it should take at the correct Higgs mass, if the Higgs were present in the data; the black dashed curve shows instead what its value should be should the Higgs not be there (background-only hypothesis, or null hypothesis if you are a statistics expert).
The dashes are only expected values: they show what is the median of the result of combining CDF and DZERO results, given that much data and given the analysis methods employed. The green and yellow band ("brazil band") instead shows the 1-sigma and 2-sigma possible ranges of the value the statistic would take for no Higgs anywhere. Of course the graph should be read by first fixing a mass hypothesis, and then reading off the values along the corresponding vertical line.
So we see that the Tevatron data does show to prefer the signal hypothesis to the no-signal hypothesis for masses between 125 and 130 GeV. Of course the discriminating power of the statistic is poor, the signal red dashed line lying just one-point-something sigma away from the dashed black one. There's more to say: the 125 to 130 GeV mass region is the one where the Tevatron's sensitivity is the worst possible, as indicated by the getting together of the two dashed curves... Still, the 1-sigmaish result is an indication, if you believe the Tevatron results to that level of detail.
That is all for today - just a teaser, I guess. But expectations for December 13th grow, despite the caution warnings. We will see what happens... Stay tuned!


Comments