

Regulars of this blog do not belong to the category of people who needs to be educated on the matter of how to read a graph. So, why should I try to distribute here any sort of user manual, given that I would certainly be doing an incomplete, mediocre job? Well, because it is still useful. If I put here some good information, maybe you can find it inspirational and end up propagating some of its contents, despite I did not teach you anything you didn't already know... The internet is a repository of information good and bad, and if we give our little contribution to increase the amount of good information, the net result is positive.
So, for today let me take a simple class of graphs: frequency distributions. They come in a multitude of forms, depending on the kind of science they summarize, as well as on some details on the quantities they report on. The first thing we should learn to do is to recognize them for what they are. This may be trivial in some cases, but not so much in others - take the two examples below, e.g.

In the first case, shown above, the purpose of the graph is immediately clear: we are looking at the relative frequency of different classes. The specific graph (taken from statology.org) shows the relative frequency of items as a function of their price. The information provided is clear: the price of this collection of items varies from 1 to 50 dollars, and there are fewer items with large price (about 6% in the highest 41$-50$ range) than with low price (in the $1-$10 and $11-$20 categories, which are the most populated). Note that a histogram like the one above has no pretense of conveying an estimate of the precision of the reported class frequencies, as there is no uncertainty bar on the relative frequencies.
I wish to draw your attention on the fact that the one above was one important choice the creator of the graph had to make (other choices, such as how many classes to divide the data into, are also important; still others of more aesthetic value, like the colouring of the bars or the choice to report relative frequencies instead of percentages, are less relevant).
Surely, the data came originally in number of items in each class - so one could have just reported the number of items, rather than the relative frequency of the classes. Relative frequencies are easier to read off: you see that the $1-$10 class contains 0.3, or 30% of the total collection, and you walk away with easy-to-grasp information; if instead the vertical axis had contained "number of items", and you found that the first class contained 742 elements, you would have had to do some homework to come up with some estimate of a percentage, if that was what you were looking for.
On the other hand, the choice to report the relative frequency with no uncertainty marks on the histogram bars (there is a number of way one could add that information to the graph) has hidden information from you. That is because reading that the first class contained 742 items you could have gotten a pretty good idea of how precise was the difference of frequency between the first and second class, e.g.: if in a collection of elements you find 742 in a sub-class and 800 in another (I am only making an example without trying to infer the relative population of those two low-cost bins above) you can tentatively say that there is a difference between their relative frequencies, because 742 is significantly different from 800 [Note, this relies on knowing some statistics and relying on assumed multinomial distribution of the data, which is probably safe to do in the displayed case]; conversely, if there had been 74 items in the first bin and 80 in the second, you would get a different message.
Ok, so the above very simple graph is immediately understandable by most of us. But can we say the same about the one below, which also reports relative frequencies? Is it clear from the outset that the purpose is to show how the frequency depends on the class displayed on the horizontal axis?
In the graph below, the bars dividing the data into classes have variable width. Some bars span intervals of 5 degrees, one has a span of 10, and the one on the right a span of 20 degrees. The vertical axis is labeled "density", which is confusing, and the range from 0 to 0.04 of the vertical axis also leaves us a bit dubious on its real meaning. So is this a relative frequency graph or not?
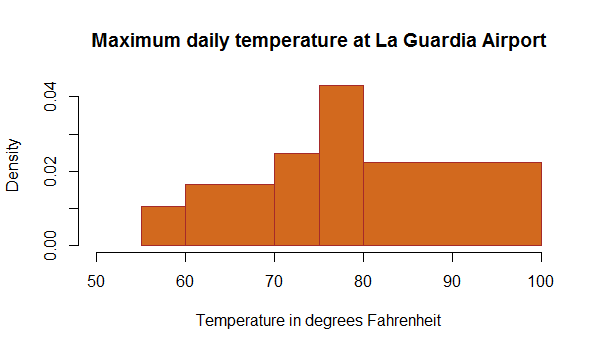
Of course, it is. But the creator, for some reason, decided to report the information in some particular format, and the result is somewhat weird. If you take care to sum up the "densities" of the five reported bins, you will reconcile yourself with the fact that the total density is indeed 1.0, as you wanted: 0.01x5° + 0.018*10° + 0.025*5° + 0.043*5° + 0.021*20° is roughly 1°. In this case such a (rough) calculation is easy, so we can reassure ourselves that we have understood the information that the graph wishes to distribute; but if there had been 100 bins, the matter could have raised doubts - something that is never a good thing in a graph supposed to clarify some data.
So the graph above after all is a relative frequency one, and it does show that the typical day at La Guardia has a peak temperature in the 75 to 80 degrees range. This in turn tells us something about the data that were used to construct it, as it would be quite strange if they referred to a winter period, or even a year-round period of observation: we would have expected to see many days with reported highest daily temperatures in the 30ies, and even below.
This observation is specific of the graph above and is only related to having been confronted with very limited information on the data collection procedures that informed the construction of the summary graph; but it suggests a general fact. When we look at a graph, and we do not know the details of how the data were collected, how they were pre-processed, filtered, aggregated, etcetera, we have to be very careful in interpreting it, and in updating our knowledge based on it.
In fact, I would tend to say that the nice graph above is close to useless as is, because none of the information bits we can read off it have any practical use. Not the peak temperature (unless we know what period of the year, or what historical time range, was considered in producing the graph); not the spread in temperatures; not the fact that there are no reported values above 100 or below 50 Fahrenheit.
Note, though, that we can only draw this conclusion because we know something about where La Guardia is: it was the process of comparing the summarized information with our prior belief on the displayed quantities that led us to decide we cannot use it. This is a very important observation, and one which demonstrates how hard it is to make sense of graphs if they are not accompanied by a careful explanation - which you typically can only extract from the scientific article that contains it.
To conclude this piece, which could only deal with a small class of graphs, albeit it is hopefully the first in a series, let me show a typical frequency distribution from a particle physics study.
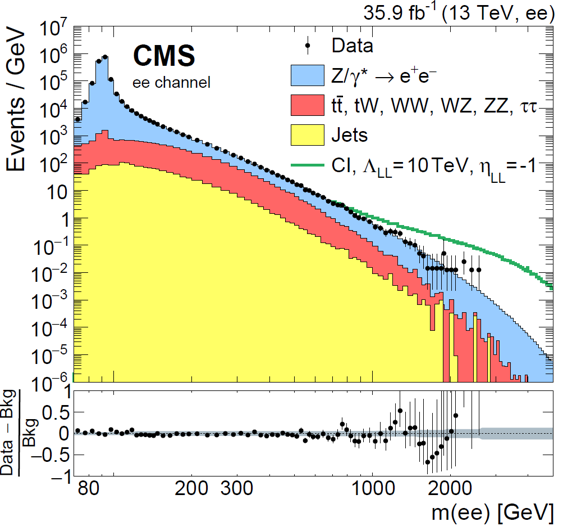
In the graph above, you immediately recognize that what is being shown is a histogram of different frequencies. This is clarified by the fact that the vertical axis reports "events per GeV", and the horizontal axis reports a different quantity measured in GeV; still, it may not be so immediately obvious to the occasional reader. What's worse, the axes are in logarithmic units, and the vertical one spans a wide range of values from a millionth to ten million events per GeV. Relating this to a relative frequency is in this case impossible without access to the original data, and even realizing that the graph still is all about that information is trickier than in the cases already seen.
The graph is made harder to read by its complexity - it reports a wealth of information all in a lump. Leave alone the lower panel, which provides a zoom-in view of the ratio between the real data frequencies (black points in the main panel) and the background model (which is the sum of all coloured histograms); the fact that the various contributing processes are stacked is implied but not explicitated (physicists will take that for granted), except that the green line is considered extraneous to the sum of the processes that are compared to the data in the lower panel.
Vertical bars appear only on the points on the right of the graph, because they are invisible for all others - again, a physicist does not even need to ask herself the question, but you might in fact have wondered why the uncertainty is so small in the points on the left: it is due to Poisson statistics assumption for the uncertainties, which are used to draw the bars. If a bin contains N events, the uncertainty can be calculated as +-sqrt(N) (it is a good approximation for large N, but not a good one for small N).
I would have a ton of other notes to make about the graph above (which, incidentally, reports on electron-positron pairs of high invariant mass measured by the CMS experiment in the search for large-mass particles that could decay into that particular final state), but I think I raised enough points to make you ponder on the fact that even by restricting ourselves to frequency graphs there is a whole world of subtleties - missing information, assumed conventions, implicit and explicit; and the chance to misinterpret these graphs is very high, especially if they are taken off context or reported without careful accompanying information.
I remember that when the CDF collaboration (an experiment that ran at the Fermilab Tevatron collider from 1985 to 2012 - a glorious one which discovered the top quark and made exquisite physics for over two decades) had to send its collaborators to conferences where they would disclose new analysis graphs which could be interpreted as implying the discovery of new processes if spun the wrong way, it insisted that the graph be only shown together with a carefully worded caption, which explained details that would usually remove any punch from the displayed data.
A sort of "caveat emptor" disclaimer of that kind was attached to a plot that Marina Cobal showed in September 1993 in Marseille, for instance: she was showing the first top quark pair candidate events seen by CDF, which she had been able to isolate from the freshly squeezed Tevatron data, but the
collaboration was not ready to go all in with a discovery claim. Despite the disclaimer, which Marina was forced to read aloud during her presentation, in that occasion the speaker herself was able to disclaim the disclaimer, explaining that she did believe the graph she was showing was indeed the first observation of top quark events. But I am divagating! If you want to read the full story, you can purchase my book "Anomaly! Collider Physics and the Quest for New Phenomena at Fermilab", or just ask for a free pdf version.
---
Tommaso Dorigo (see his personal web page here) is an experimental particle physicist who works for the INFN and the University of Padova, and collaborates with the CMS experiment at the CERN LHC. He coordinates the MODE Collaboration, a group of physicists and computer scientists from eight institutions in Europe and the US who aim to enable end-to-end optimization of detector design with differentiable programming. Dorigo is an editor of the journals Reviews in Physics and Physics Open. In 2016 Dorigo published the book "Anomaly! Collider Physics and the Quest for New Phenomena at Fermilab", an insider view of the sociology of big particle physics experiments. You can get a copy of the book on Amazon, or contact him to get a free pdf copy if you have limited financial means.


Comments