

Collider detectors collect information from subnuclear particle reactions by taking snapshots of the particles that get radiated from the collision point, through a number of different devices that record the interaction those particles entertain with the media they traverse. The amount of information we need to process is staggering: we are talking about a hundred million readout channels per each collision events. Fortunately, we can construct "high-level features" by reconstructing those particle hits and assigning them to scores of "stable particles", i.e. ones which live long enough to leave the interaction region and entertain encounters with atoms of the detector we built around it.
While high-level features constitute a giant simplification of the problem, they still span a multi-dimensional space of tens of dimensions. If our problem is to scan that space in search of odd clusterings that may be the result of a new physics process, we need to equip ourselves with suitable tools - our mind can't think straight in more than 3D.
And there is one additional problem, which arises as soon as we declare that we are interested in overdense regions of our feature space: hadron collider data such as those we collect with ATLAS and CMS, exploiting the proton-proton collisions generated by the CERN Large Hadron Collider, naturally come in at very wildly varying density in the feature space. This is the result of the collisions being originated by quarks and gluons inside our projectiles hitting each other hard or soft, depending on what fraction of the total proton energy they happened to share at the time of the interaction. To give you an idea of how much variation there is in the probability of a collision as a function of one event feature - in this case the equivalent mass of pairs of electrons and positrons recorded by CMS - have a look at the graph below.
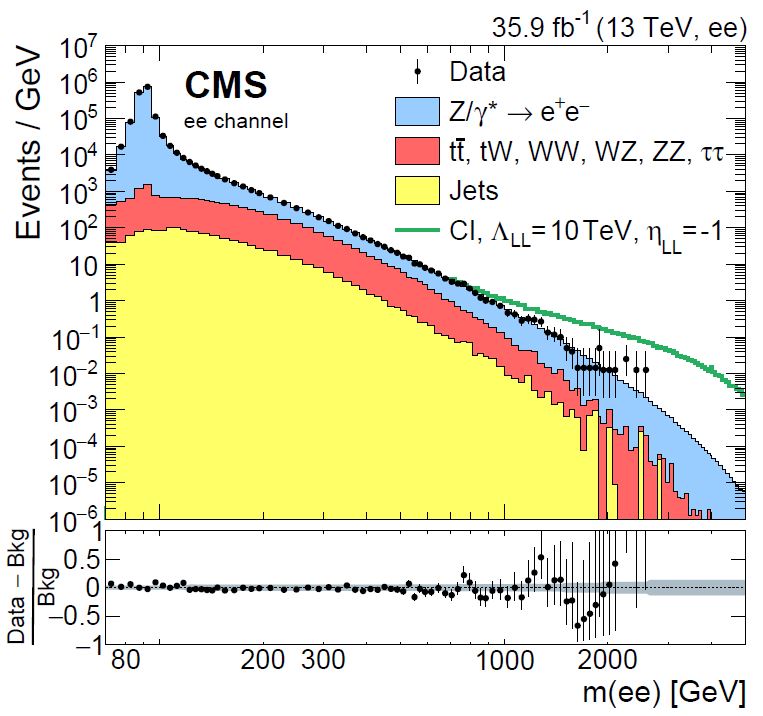
Yes, the density variations above, in a dataset collected by searching for electrons and positrons in recorded collisions by the CMS experiment, span 9 orders of magnitude! How can we even speak of being sensitive to "density variations" in such a situation? Surely we give for granted that we know the distribution of the "non anomalous" data, such that we can detect differences from it?
No. We can in fact still operate in an unsupervised fashion, thus renouncing to any assumptions. By freeing ourselves from the need to specify a model of the data - the "non-anomalous" part - we acquire more generality and nullify any mismodeling uncertainties, which are especially impactful in the regions of phase space of the data which are the most interesting as a hiding place for new physics processes, exactly because we have a less precise understanding of them.
How do we do that? We take each feature -a real-valued quantity- and independently "stretch it or shrink it" in different parts of its spectrum, such that it looks perfectly flat. By applying a transformation (which is called "integral transform") that makes the distribution flat, we have not removed information from the variable - the information has moved from the variable itself to the transformation law. But crucially, the multi-dimensional structure of the data subjected to similar integral transforms on all marginals still contains all the correlations, agglomerations, and information-rich structure of the original dataset. What we are now looking at is the so-called "copula space", where the data has flat marginals in all directions. By additionally remapping each transformed variable into the [0,1] range, we have a n-dimensional hypercube, which we can then scan in search for overdensities.
Now, what does RanBox do to identify suspicious regions of that hypercube? It casts a multi-dimensional interval in the subspace of the full feature space, and moves it around in all possible directions. Every time the number of data points captured inside the box is compared to an expectation based on events belonging to a multi-dimensional "frame" surrounding the search box.
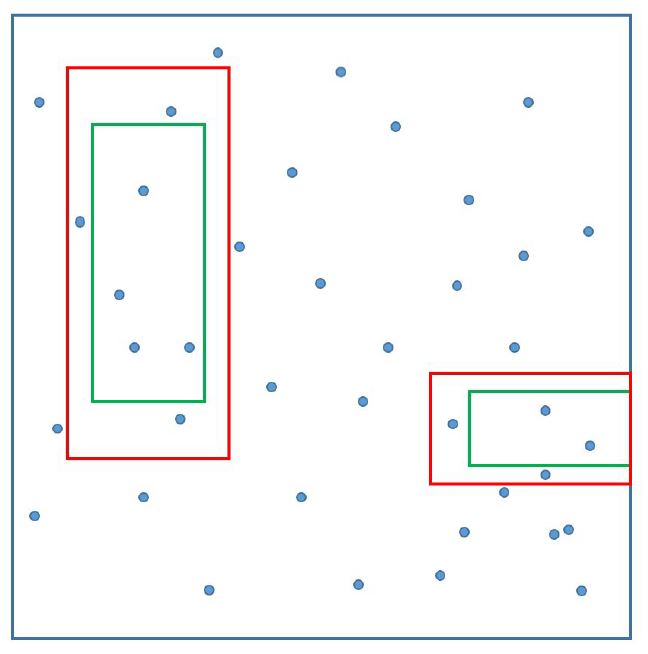
[Above, the green signal box and the red "frame" are shown as projections over a two-dimensional space; two examples are given of possible configurations, but bear in mind that in 30 dimensions, e.g., the "frame" will interest extremely narrow regions on each side of the signal box, as we want it to have the same total volume of the search box].
The box navigates by gradient descent the multi-dim space toward the region which maximizes the significance of the observed number of events, given the expectation. An example of the result is shown below. Notice how a local overdense region has been nicely rounded up from an initially flat data distribution.
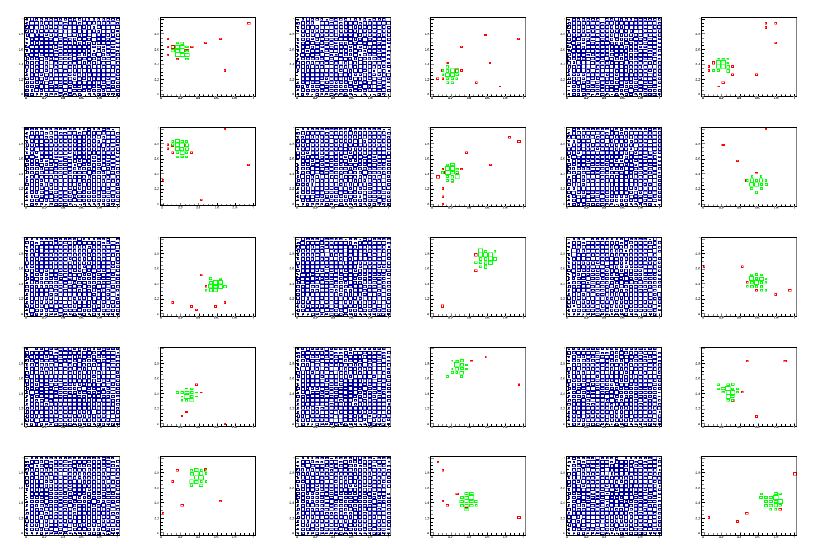
[Above: each pair of graphs in each row show different 2-dimensional projections of the full dataset (blue) and the data selected by the RanBox algorithm (green). Events in red are ones that fail the box selection only because of the value of their features in the two dimensions displayed. From top to bottom, left to right, this particular 6-dimensional space is shown by its projections in features (1,2), (1,3), (1,4) (first row); (1,5), (1,6), (2,3) (second row); (2,4), (2,5), (2,6) (third row); (3,4), (3,5), (3,6) (fourth row); (4,5), (4,6), (5,6) (fifth row). The 6D box lives in a subset of the 20-dimensional space.]
You might be surprised to learn that if some data show completely uniform distribution in all of the variables, they can contain a large amount of information in the multi-dimensional space they span. But it is a trivial fact: correlations and interdependencies do that. In fact, it may be hard to distinguish a locally dense region in the copula space which is due to a contribution from a new physics process from regions that are locally dense due to the "normal" internal structure of background events. This is particularly the case when the correlations between features in background events is large.
To see this, let us consider what happens in a 30-dimensional space, populated by 10 billion events, and where 10 of the variables of the data are identical copies. These variable are therefore 100% correlated. Now, if I consider a 10-dimensional interval in the subspace spanned by those variables, of width equal to 10% of the range of the data -e.g., the range [0.3,0.4] in all directions- that interval will contain 10% of the data, because if one variable has value in [0.3,0.4] (which happens 10% of the time) _all_ of them do. The box will thus contain one billion events. This box, on the other hand, will have a volume of 0.1^10, or a tenth of a billionth. If the data were uniform, the box would be expected to contain on average one event. There is thus a discrepancy of a factor of a billion between how many events could be predicted to lie within such a small box, and the actual number of events we find there, and this is entirely due to the internal 100% correlation of the 10 features we've chosen to build a box!
To search for overdensities one may therefore decide to avoid variables that are highly correlated in defining the search space. There are several ways to do that; one of them is called "principal component analysis" and is implemented in RanBox; a better algorithm is however an iterative one which discards variables that have large correlation coefficients with others.
After showing the power of RanBox on synthetic data constructed to be sampled from a uniform distribution, in our work we considered three different datasets to test how RanBox performs. One of them is a classic "collider data" sample which is made up by simulated backgrounds and a simulated new particle signal, as measured by ATLAS. A second one is a mixture of electron neutrino interactions in miniboone and backgrounds. A third is a dataset describing credit card transactions in Europe, where some of them are fraudolent. In all cases, RanBox manages to located boxes that are rich in the signal component, without any instructions on what is anomalous about the data!
Consider, e.g., the following table. It shows the performance of search runs in the first dataset (available in the UCI machine learning repository, and dubbed "HEPMASS"). The second column reports the number of signal and background events in the whole dataset; the third column shows the value of the test statistic that was maximized by the best box (in this case, it is the ratio of observed events divided by predicted events in the box, plus 1.0); the fourth column shows the number of events found in the box and the expected number; and the fifth shows the signal events captured in the box. The column "Gain" shows instead the increase in signal fraction in the best box with respect to the original dataset.
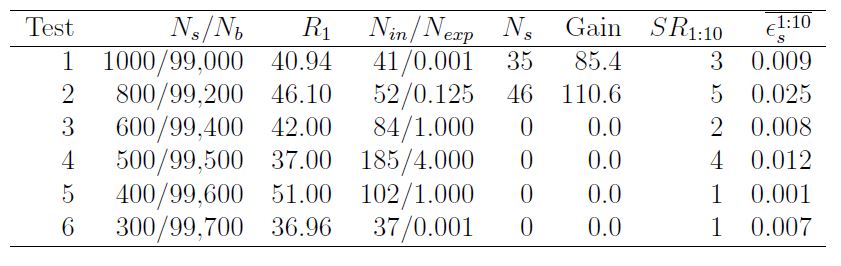
As you can see, the best box returned by RanBox in tests 1 and 2, where the new physics signal amounts to 1% and 0.8% respectively, is rich with the signal component. Also, the last two columns report the number of signal-dominated boxes among the 10 most significant in each run, and the signal efficiency averaged over those boxes. One observes that even for 0.3% and 0.4% contaminations there is one reported box that is rich in the signal component.
RanBox has surprisingly good performances, considering how simple it is. Other anomaly detection algorithms are in fact much more complex than this. RanBox is not only simple but also very unassuming - it does not need any model of what it has to search for. It is fully unsupervised. I can't wait to test it on real collider data... But I will first of all test it on ATLAS open data, as this allows me to publish without having to go through internal collaboration screening!
---
Tommaso Dorigo (see his personal web page here) is an experimental particle physicist who works for the INFN and the University of Padova, and collaborates with the CMS experiment at the CERN LHC. He coordinates the MODE Collaboration, a group of physicists and computer scientists from eight institutions in Europe and the US who aim to enable end-to-end optimization of detector design with differentiable programming. Dorigo is an editor of the journals Reviews in Physics and Physics Open. In 2016 Dorigo published the book "Anomaly! Collider Physics and the Quest for New Phenomena at Fermilab", an insider view of the sociology of big particle physics experiments. You can get a copy of the book on Amazon, or contact him to get a free pdf copy if you have limited financial means.


Comments