

A greenhouse keeps an air volume warm mainly by enclosing it as fixed volume of air. From that perspective, the term 'greenhouse gas' is a somewhat unfortunate choice of term. But we seem to be stuck with it.
Obsolete books and web site pages continue to describe the atmosphere in terms of 'well-mixed gases'. That is counterfactual. Gases entering the atmosphere from whatever source can take a very long time indeed to become well distributed even even within a single hemisphere. Or even within a single atmospheric layer.
Figures cited for CO2 such as 389 ppm are global average distributions. This average figure is an artificial construct. Any attempt to disprove the global warming effects of anthropogenic CO2 based on the tacit assumption that the ppm figure applies to a well-mixed gas is a fallacy of the average.
The Fallacy Of The Average is based on the false notion that the effect of a thing averaged out is equivalent to the effect of any randomly chosen specific instance of the same thing. Imagine taking the average annual precipitation for your country or state and having it all dumped on one town or city in a single day.
Another example: the average point on our planet is under 4 kilometers of water. See:
Understanding Climate : #6 - Hypsography.
Atmospheric CO2 is not well mixed
Any instantaneous snapshot of the earth's atmosphere does not reveal an even distribution of well mixed gases. Specific to this article: the amount of CO2 is averagely higher in the Northern than in the Southern Hemisphere as a result of the combustion of coal, oil, and natural gas. Again, within either hemisphere, the CO2 is averagely higher within specific zones of latitude.
The people who update the Keeling curve know this. From what I read on the web, the majority of Keeling curve detractors are strangers to the concept of uneven distribution.
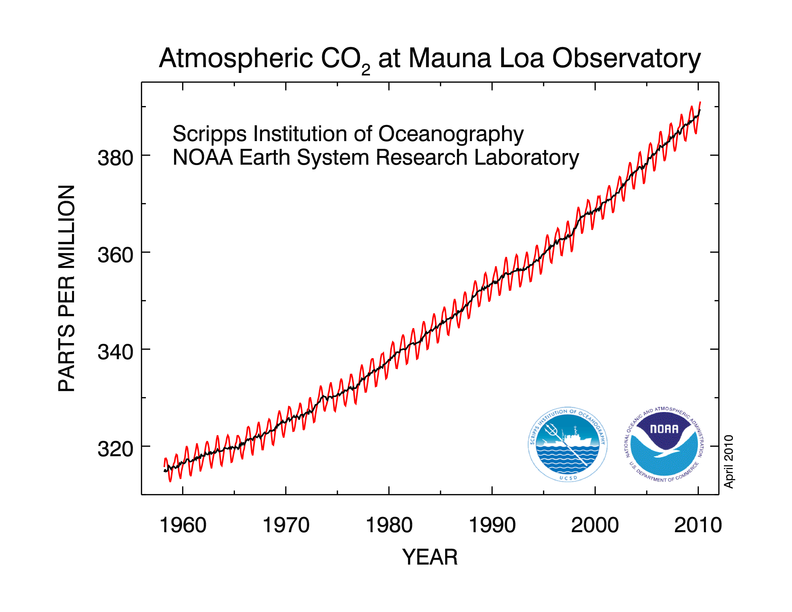
The table shows annual mean carbon dioxide growth rates for Mauna Loa.Please note: "an average for the globe".
The annual mean rate of growth of CO2 in a given year is the difference in concentration between the end of December and the start of January of that year. If used as an average for the globe, it would represent the sum of all CO2 added to, and removed from, the atmosphere during the year by human activities and by natural processes.
...
The estimated uncertainty in the Mauna Loa annual mean growth rate is 0.11 ppm/yr.
http://www.esrl.noaa.gov/gmd/ccgg/trends/#mlo_full
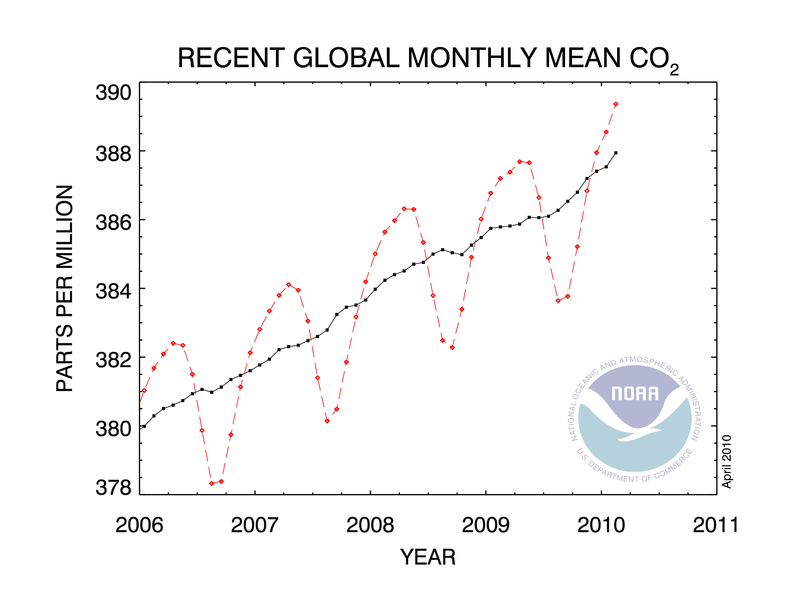
The graph shows recent monthly mean carbon dioxide globally averaged over marine surface sites.
The Global Monitoring Division of NOAA/Earth System Research Laboratory has measured carbon dioxide and other greenhouse gases for several decades at a globally distributed network of air sampling sites (Conway, 1994). A global average is constructed by first fitting a smoothed curve as a function of time to each site, and then the smoothed value for each site is plotted as a function of latitude for 48 equal time steps per year. A global average is calculated from the latitude plot at each time step (Masarie, 1995). The last four complete years plus the current year are shown here. The last year of data are still preliminary, pending recalibrations of reference gases and other quality control checks.
http://www.esrl.noaa.gov/gmd/ccgg/trends/#mlo_full
We have confidence that the CO2 measurements made at the Mauna Loa Observatory reflect truth about our global atmosphere. The main reasons for that confidence are:
1. The Observatory near the summit of Mauna Loa, at an altitude of 3400 m, is well situated to measure air masses that are representative of very large areas.
2. All of the measurements are rigorously and very frequently calibrated.
3. Ongoing comparisons of independent measurements at the same site allow an estimate of the accuracy, which is generally better than 0.2 ppm.
http://www.esrl.noaa.gov/gmd/ccgg/about/co2_measurements.html
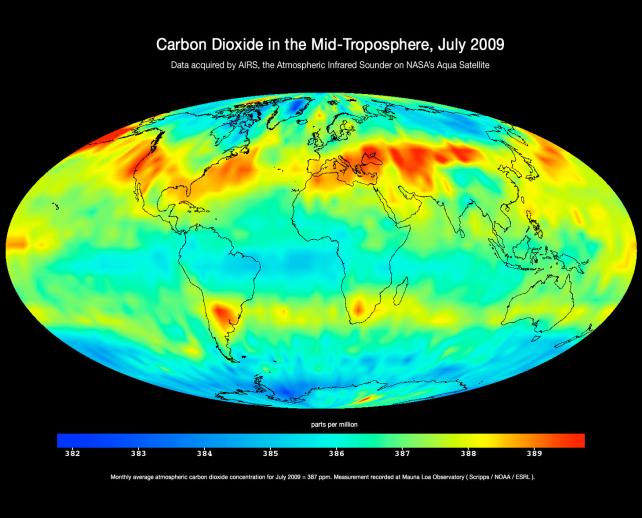
Satellite data shows conclusively that CO2 is not well mixed in the atmosphere.
http://photojournal.jpl.nasa.gov/catalog/PIA12339
Launched into Earth-orbit on May 4, 2002, the Atmospheric Infrared Sounder, AIRS, moves climate research and weather prediction into the 21st century. AIRS is one of six instruments on board the Aqua satellite, part of the NASA Earth Observing System.
...
AIRS uses cutting-edge infrared technology to create 3-dimensional maps of air and surface temperature, water vapor, and cloud properties. With 2378 spectral channels, AIRS has a spectral resolution more than 100 times greater than previous IR sounders and provides more accurate information on the vertical profiles of atmospheric temperature and moisture. AIRS can also measure trace greenhouse gases such as ozone, carbon monoxide, carbon dioxide, and methane.
http://airs.jpl.nasa.gov/overview/overview/
Painting the greenhouse
Some deniers of anthropogenic global warming and / or the effect of CO2 as a 'greenhouse gas' are taking the greenhouse analogy too far. One of their arguments goes like this. If you paint a window you cut down the light. Another coat of paint cuts the light further. There soon comes a time when adding another coat of paint makes no difference. It follows that after a certain level, adding more CO2 makes no difference. Couple that with a fallacy of the average CO2 ppm and you have cooked yourself a very nice red herring.
Have these people never heard of the planet Venus? Its atmosphere is about 97% CO2. The surface temperature is 460o C. Anybody who suggests a 'cut-off' line where more CO2 makes no difference to warming had best explain where that cut-off lies within the 97% CO2 on Venus. The Venus day is 243 earth days. Its night is 243 earth days. No, not earth nights. 'Days' as in 24 hour periods. The temperature difference between Venus day and Venus night is entirely trivial. This is due to the blanketing effect of an atmosphere with 97% CO2 and a fair bit of SO2, the strongest greenhouse gas effect in the solar system.
If you paint a window, it blocks the light, sure. But even if you painted it with a foot thickness of paint it would not stop your house cooling down in winter if you turn off the heating. 'Light' is not a synonym for 'electromagnetic radiation', it is just a small part of a very wide spectrum. There is no such thing as a perfect heat insulator. Paint is a poor conductor of heat, but an infrared camera would soon reveal that a painted window doesn't block heat transmission.
Anyway, its an entirely spurious analogy. CO2 doesn't work like that. CO2 is more akin to refractory materials. It absorbs heat and then re-emits it. When a refractory material does that in a steam engine's firebox or in a furnace it has a major amplifying effect on temperatures. There is no upper limit on thickness other than the fact that the train has to fit under bridges.
So there you have it. Argue the effects of various quantities of CO2 by all means. But remember that the ppm average means lots and lots of square kilometers of land and ocean with low CO2 levels and far fewer densely inhabited square kilometers with excessively high CO2 levels.
And I haven't even begun to discuss the vertical distribution in our layered atmosphere.


Comments