Banner
    Is The 'plants Love CO2' Theory Valid?
    By Patrick Lockerby | May 11th 2010 01:55 PM | 4 comments | Print | E-mail | Track Comments
    About Patrick

    Retired engineer, 60+ years young. Computer builder and programmer. Linguist specialising in language acquisition and computational linguistics....

    View Patrick's Profile
    Is the 'plants love CO2' theory valid?

    Plants use CO2 from the atmosphere to grow.  It follows that more CO2 will promote more growth.  That is the gist of the 'plants love CO2' theory.  But is the theory valid?


    In a recent article I argued that Plants Can't Sequester Excess CO2.
    In this article I examine the matter further.


    If it is true that plants will adapt to rising CO2 levels by absorbing more CO2 then there are logical consequences to be expected.  One way to test a theory is to show the expected consequences of the theory and compare that with observed experimental data.  Let us do that with the theory that plants can, or do, or will make use of excess CO2.


    The global atmospheric CO2 cycle.

    An oversimplification: animals breathe in oxygen and breathe out carbon dioxide.  Plants breathe in carbon dioxide and breathe out oxygen.  The two mechanisms are in balance.

    The actual distributions of O2 and CO2 over time are more complex.  Some animals hibernate in winter.  Some plants die off or lose their leaves in winter.  Many plants slow or stop their CO2 uptake in winter.  Northern winter coincides with southern summer, so you might expect an average balance over the course of a year.  You would expect wrongly.

    In a recent article - Understanding Climate : #6 - Hypsography - I showed that there is much more land in the northern hemisphere than in the southern one.


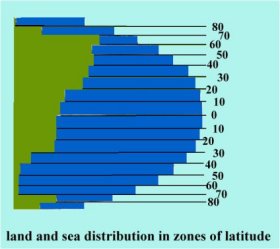
    The northern and southern seasons do not completely offset each other.  The northern hemisphere is dominant in its effects on atmospheric CO2 and O2.


    Expected observations of balanced CO2 levels

    Because there is more land area in the northern hemisphere we can reasonably expect more green plants.  For 6 months of the year the northern hemisphere animals produce more CO2 than can be taken up by still-active plants.  The CO2 level climbs to a peak.  Then summer kicks in and plants begin to take up more CO2 than the animals are producing.  The plants overtake the animals and the CO2 level drops to a minimum.  This cycle repeats every year, as roughly indicated in the next diagram.


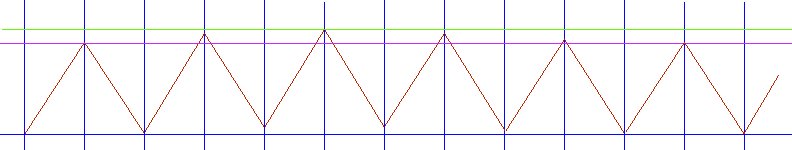
    There is some jitter in the CO2 levels.  It may happen that CO2 is released by a volcano or by some other intermittent occurence.  The peak CO2 goes up - to the green line in the diagram - but then comes down as plants react to the temporary excess CO2 by absorbing it.

    That seems reasonable.  There is some slack in a plant's ability to take up CO2.  Excess atmospheric CO2 is soon removed by plants and the level drops to whatever is 'normal' for summers end in that geological era.

    The 'slack' doesn't allow CO2 levels to drop to zero.  The physical chemistry of CO2 uptake loses efficiency as CO2 levels fall.  Also, the plants only have 6 months to absorb CO2.  There will be some average minimal level of CO2 at the start of every winter.  The real waveform would not be a sawtooth, but the diagram serves to show a basic principle: CO2 levels start at a summer low, climb to a winter high and then fall again.  According to the theory that plants will remove excess CO2, the long term trend for CO2 levels is a horizontal line.


    Expected observations of rising CO2 levels

    The theory under investigation suggests that plants will - presumably without limit - absorb any excess CO2.  More CO2 stimulates plant growth.  It follows logically that as CO2 levels rise, the amount of CO2 uptake will increase.  This will show up in graphs.  Each increment of CO2 will show up as a higher end of winter value, and each summer at least some of that excess will be taken up.  Whether the plants keep pace with rising CO2 or not, the difference between the high and low CO2 values will show a trend towards annual increase.  The sawteeth will get bigger.


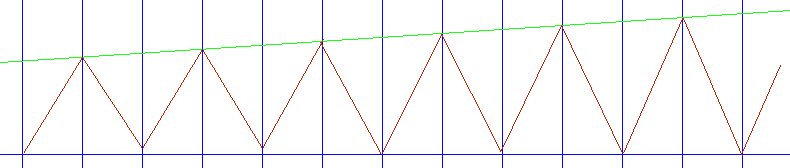
    The theory that plants will absorb whatever CO2 is available 'predicts' that, with rising inputs of atmospheric CO2, measurements of atmospheric CO2 will show a trend of ever greater differences between winter highs and summer lows.  If the plants fail to keep pace with changes in CO2 levels, the graph will look something like the one below.


    Discussion:

    The  'plants love CO2' theory states that CO2 is good for plants and that plants will thrive on  - i.e. absorb - excess CO2.

    If the theory is broadly valid then graphs will show an annual increased uptake trend - or at least a decadal increased uptake trend. The difference between annual high and annual low atmospheric CO2 levels - the measure of global CO2 uptake - will increase, but mean CO2 levels will continue to rise.

    If the theory is completely valid then graphs will show a trend towards ever higher seasonal CO2 levels but the lower CO2 level will show no overall long-term upward trend.

    If the theory is not valid, then as CO2 levels trend upwards, both annual low and annual high CO2 levels will show a matching trend.


    Is the 'plants love CO2' theory valid?

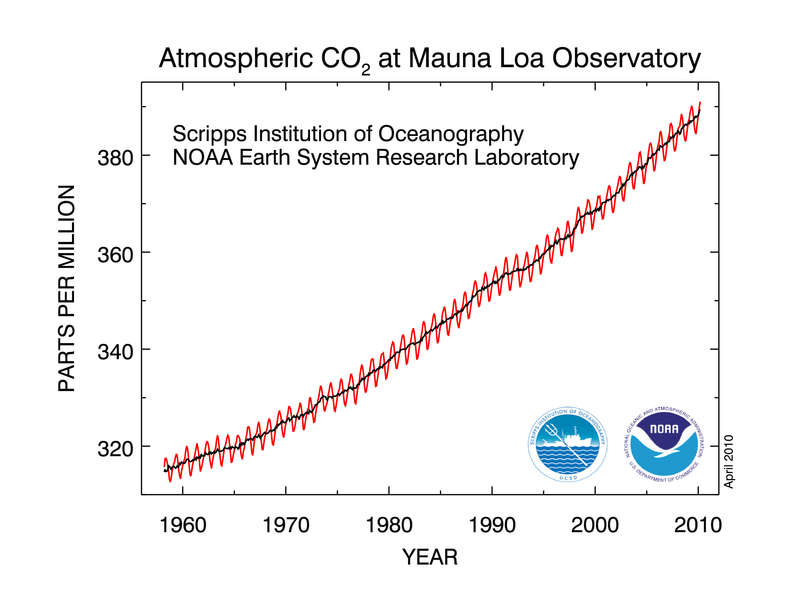
    There follows a graph of actual measured annual high and low CO2 levels.  Measurements have been made to a consistently high standard at one geographical location and at a constant altitude.

     We have confidence that the CO2 measurements made at the Mauna Loa
    Observatory reflect truth about our global atmosphere. The main reasons
    for that confidence are:


       1. The Observatory near the summit of Mauna Loa, at an altitude of
    3400 m, is well situated to measure air masses that are representative
    of very large areas.
       2. All of the measurements are rigorously and very frequently calibrated.
      
    3. Ongoing comparisons of independent measurements at the same site
    allow an estimate of the accuracy, which is generally better than 0.2
    ppm.
    http://www.esrl.noaa.gov/gmd/ccgg/about/co2_measurements.html


    Comments

    Amateur Astronomer
    Patrick,

    I believe the critical consumption of CO2 is in the oceans rather than on land.

    On land the plants have to balance water nitrogen, phosphorus, and sulfur in a system where CO2 is seldom the limiting factor.

    An accurate calculation is hard to get. One way I look at CO2 consumption in plants on land is that the fuel being burned can not be replaced by burning wood, grass, or leaves. By one account in the ethanol industry, only about 10% to 15% of petroleum can be replaced by agricultural products. It means that CO2 production from burning fossil fuel is 7 to 10 times higher than land plants can consume.

    Already we rely on the oceans to compensate for CO2 production. You gave a graph from a mountain top of an island far from containments. It shows that the oceans are also over loaded with CO2 and cannot recycle all that we produce. That can change if the temperature rises, polar ice melts, and the oceans expand into shallow coastal regions. Then the oceans probably can handle the extra CO2, but that seems like the hard way to do it.

    I support a variety of alternatives like wind farms and solar furnaces, as well as synthetic fuels and efficiency measure to get more value from the fuel we burn. These things taken together over time can balance the CO2 production and consumption by actions that are not causing more harm than good. At present the alternatives are locally important for changing the cash flow.

    Recently I visited the large wind farms in California, Texas, and Illinois. One county in Texas has 15,000 people and 3 billion US Dollars of wind farm investments giving 10% of total income from wind industry. I would suggest that the carbon foot print of those people is rather small, although they also produce petroleum and natural gas. Cash flow from wind power is about $115,000 per hour per hour or about one billion US dollars per year. The amazing thing was that the potential wind sites in that county were only about 1% occupied by wind farms, and the installed capacity tends to double every few years, driven by a local tax incentive instead of a national mandate.

    CO2 world wide is a problem, but a lot of the remedies look worse than the illness. A reasonable policy worked out over time can provide the permanent fix, but that's not what I hear at the national level. It is very hard to get an accurate report unless you collect the data yourself.
    logicman
    Jerry: the Mauna Loa graph, aka the Keeling curve shows an integrated graph of measured atmospheric CO2.  The annual highs get higher and the lows get higher.  That is after all natural CO2 sequestration mechanisms have sequestered as much CO2 as they have capacity for.  If any mechanism showed increased capacity it would show in the graph.

    Warmer oceans absorb less CO2.  As rising sea levels inundate low sloping coasts that will mean more shallow water.  Shallow waters warm faster than deeper waters.

    I support a variety of alternatives like wind farms and solar furnaces, as well as synthetic fuels and efficiency measure to get more value from the fuel we burn. These things taken together over time can balance the CO2 production and consumption by actions that are not causing more harm than good. At present the alternatives are locally important for changing the cash flow.

    I'll go along with that.  One problem here in the U.K. is that a few people who value their right to an unspoiled view of the landscape higher than the rights of future generations to an unspoiled planet can block the installation of windfarms.  I would make a terrible politician.  I would grant them the right not to have a windfarm, but deny them the right to have electricity.

    Windmills have small footprints and have a trivial impact on farm land.  Coal fired power stations have massive footprints and totally deny the land to other uses.

    When progress makes the windmill obsolete it can be removed at low cost.

    When progress makes the coal fired power station obsolete there are huge costs of cleaning up the polluted land.
    How do you know the oceans are 'overloaded' with CO2?
    How do measurements from a mountain top prove this?
    Utter tosh.

    BTW wind-farms are massively inefficient and need to be backed-up all the time by 'evil' gas-burning generators. If you want really green power generation then embrace nuclear, it's perhaps one of the greatest inventions of mankind. However, watermelons don't like nuclear power-stations as they don't mean we have to go back to the stone-age to live out our lives.

    Don't be hoodwinked by the UN and the Club of Rome. They're just using AGW nonsense to bring about a one-world government.
    Embrace skepticism. All true scientists are skeptics.

    Aitch
    Looks like you just ruled yourself out as being a Scientist, then, Andy!
    I AM a skeptic, and abhor Nuclear.
    The cleanup of 'waste' from nuclear is more long term than any of us alive on the planet today, plus over ten generations of our offspring
    Really well thought out sustainable future - NOT!
    [btw only some badly designed wind power devices need to be backed up by gas-burning generators - but that was a political decision to deter the public from supporting it!]

    Common sense will win in the end, as always, and all the daftness and attitude will be dust

    Aitch

    Add a comment

    The content of this field is kept private and will not be shown publicly.
    • Allowed HTML tags: <sup> <sub> <a> <em> <strong> <center> <cite><TH><ul> <ol> <li> <dl> <dt> <dd> <img> <br> <p> <blockquote> <strike> <object> <param> <embed> <del> <pre> <b> <i> <table> <tbody> <div> <tr> <td> <h1> <h2> <h3> <h4> <h5> <h6> <hr> <iframe><u><font>
    • Web page addresses and e-mail addresses turn into links automatically.
    CAPTCHA
    If you register, you will never be bothered to prove you are human again. And you get a real editor toolbar to use instead of this HTML thing that wards off spam bots.