


The maximum land deformation, shown in before and after pictures, is 8 miles away. The two acquisition dates lead to rainbow-colored interference patterns in the combined image, known as an ‘interferogram’, enabling scientists to quantify the ground movement.
Sentinel-1A’s swath width of 250 km over land surfaces has allowed for an unprecedented area size to be analyzed from a single scan. The entire area will be covered under the same geometry every 12 days, allowing for the wider region to be regularly monitored and fully analyzed for land deformation with the powerful ‘interferometry’ technique. Sentinel-1A is the first satellite for the Copernicus environment-monitoring programme led by the European Commission. Its all-weather, day-or-night radar imagery is particularly suited to support impact assessment for many types of geohazards. The satellite is planned to provide systematic observations of tectonic and volcanic areas at global level and Copernicus EMS was activated on the day the earthquake struck.
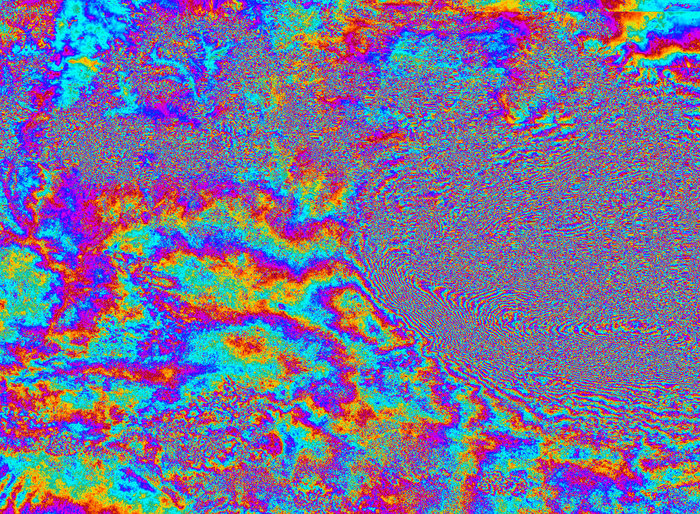
Interferogram over Kathmandu, Nepal, generated from two Sentinel-1A scans on 17 and 29 April 2015 – before and after the 25 April earthquake. Each ‘fringe’ of color represents about 3 cm of deformation. The large amount of fringes indicates a large deformation pattern with ground motions of 1 meter or more. Contains Copernicus data (2015)/ESA/DLR Microwaves and Radar Institute/GFZ/e-GEOS/INGV–ESA SEOM INSARAP study.
Full coverage of the affected area prior to the earthquake were available to all scientists under the Copernicus free and open data policy, and will continue to be available.


Comments