

The fact is that whenever I set out to explain a new result from ATLAS or CMS (the two huge detectors collecting data from the proton-proton collisions delivered by the Large Hadron Collider -LHC in the following- at CERN) I invariably fail to provide all the background information that would be necessary to really decrypt those graphs showing particle production rates versus particle masses. There is just too much to say, and I always have to make some tough choice, explaining some things and omitting others, thus leaving some of the readers behind.
Now since we are at the start of a new year, let us take the chance to discuss the generalities of a search for a new exotic particle without being distracted by any particular new result, which would divert our attention.
The first thing one needs to realize when we discuss the chance of producing new particles at the LHC is that we are talking about rare phenomena. If these new particles were produced copiously when we collide protons and turn their kinetic energy into new matter, we would have discovered them all on the first day of running! Instead, we continue to accumulate data, because the more collisions we study, the deeper we may dig in the search for rare, or how we familiarly call them "exotic" processes (the two things are not exactly the same, but here I will just be happy with the slight inaccuracy).
So we need high energy but also high collision rates, higher than previously available ones. At a hadron collider such as the LHC the two things are tightly interconnected. That is because of something called "parton distribution functions". Partons are the constituents of protons: quarks and gluons. But what are their distribution functions ?
When we impart to the protons the maximum available kinetic energy -4 TeV to each of the colliding projectiles, for a total centre-of-mass energy of 8 TeV-, the collision that takes place is between one quark or gluon in a proton and a quark or gluon in the other proton. Each of the constituents of protons carries only a fraction x of the total energy (with 0<x<1), so the energy available to create new states of matter is always much lower than 8 TeV: instead of 4+4 it is computed as (4+4)*x1*x2, where x1 and x2 are the two energy fractions.
The probability to find partons with a fraction x of the total energy is called "parton distribution function". It is different for quarks and gluons, but for both it peaks at values very close to zero, and decreases very quickly as x increases: only one collision in a thousand has each of the two partons carrying a tenth of the proton energy, and larger fractions are still less probable. So in order to exploit to the fullest the large collision energy of the LHC we need to collect as many collisions as we can. A new particle with a mass of 4 TeV can be produced, but it might take a while to do it!
So we are coming close to the heart of the matter. For any given new particle that theoretical physicists hypothesize to exist as a result of their "extensions" of the current theory of subatomic particles (what we call the "standard model"), it is possible to compute the rate at which the particle would be produced in LHC collisions. This rate depends on the particle mass, and it is invariably a strongly decreasing function of the mass, because of the increasing rarity of more energetic collisions: the higher the mass, the higher the required energy, and so the higher is the demand on the energy fractions of the colliding partons.
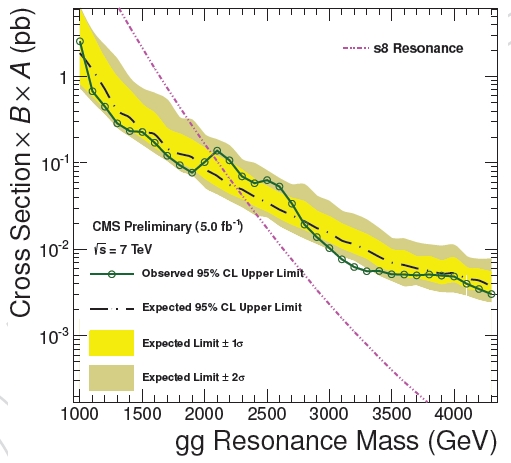 One can finally graph the "production cross section" of the hypothetical particle as a function of the hypothetical mass. An example is shown on the right (just look at the steeply falling pink dashed curve).
 You notice that the graph is semi-logarithmic: the vertical axis spans orders of magnitude in the production cross section -which corresponds to the number of particles produced for a given amount of collisions. Double the particle mass, and the production rate sinks by a factor of 100 or more.
Now imagine that you search for the particle in the collisions you have collected. In the simplest case -one rarely achieved in practice, but we will take it as our case study here- the signal of production of the particle would be unmistakable, being something that no other process can mimic: a background-free signature! One would then need to observe just one such event to be able to claim its discovery.
If one does not observe any such event, it is down to maths. That is to say, having seen zero events you can make some statistical inference and squeeze some information on the possible particle production rate. For suppose, for instance, that the particle existed, and its cross section were such that in the analyzed data you should have seen 5 events on average: the distribution of event counts is a Poisson function, and its study allows us to compute the probability that we see zero events when 5 are expected. This turns out to be a very small number (0.7%), so we can confidently "exclude" that the particle is produced with the given rate, unless we are willing to accept that we have been quite unlucky!
In general the convention is that we accept to have been "5% unlucky": in other words we compute what is the expected rate such that the chance to observe zero events is 5%, and we then declare that we exclude rates higher than that, on the basis that we accept to have been unlucky, but not too much. Let us make a numerical example: if the expected rate is one event, there is a very significant probability that no events are seen (27%); if the expected rate is two events, the probability to see zero is 14.5%; if the expected rate is three events, the probability is 5%. There: we then say we can "exclude rates higher than three events", at a "level of confidence" of 95%.
Now we go back to the rate versus mass graph: we can now draw a horizontal line at 3 events, and say that any production rate higher than that is excluded by our having seen no events, "at 95% confidence level". since this line divided the graph in two halves, one of which is excluded, we can take the surviving part of the curve describing the production rate versus mass of the hypothetical particle, and observe that only masses above a certain value M are possible, because below that value the rate would have been too high for us to end up with an empty net.
In the graph above, in place of a straight horizontal line you see a green curve connecting empty circles, and wiggling around, slightly decreasing with increasing resonance mass: the excluded rate is not constant as a function of mass, because for different mass values the acceptance of the experiment is different; but that is a detail on which we may avoid focusing today. What is important is that the exclusion line intercepts the pink theoretical prediction line at a mass M of 2100 GeV: resonances of lower mass are excluded, because they would have produced a visible signal in the data, which was not seen.
So there you have it: our experiment has "excluded the existence of the particle at masses below M, at 95% confidence level". Is this a significant find ? Well, of course it is a much less appealing result than the observation of the particle! Still, it is valuable information: theoretical physicists can now go back to their model-building chalkboard knowing that if their pet model included by necessity a particle with the searched characteristics and mass lower than M, they have better trash it and conceive something different.


Comments