

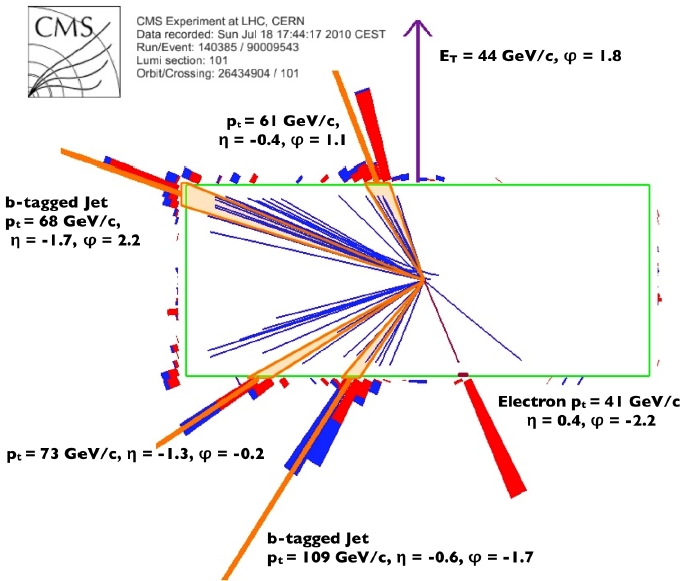
Below you can see a top pair candidate from CMS: the detector is shown from a side, and four jets, an electron, and large missing transverse energy are labeled with their kinematical properties. This event features two b-tagged jets, and it is much more likely of being due to a true top-pair production than to anything else.
Getting back to a comparison of Tevatron and LHC on top production, as a sheer number of top quark pairs the LHC bounty is still less than a tenth of that accumulated by the Tevatron, but the much larger signal-to-noise ratio granted by the higher center-of-mass energy will soon grant fewer background-induced systematics to the measurements underway.
The above should not be taken to mean that the most precise measurements on top quark physics of the next winter conferences will come from the LHC! Quite on the contrary, it will take at least a couple of years until top quark properties get investigated with higher precision in Europe than in America. But the trend is clear.
I have recently explained here that the complications due to a precise calibration of the jet energy scale (that is, how well the miscalibration of the jet energy measurement is modeled by the simulation) will keep the most precise top quark mass measurements in America for several years. However, many other measurements whose precision is driven by statistical uncertainties on signal and backgrounds are going to see ATLAS and CMS prevail quite a bit sooner.
[Note: the "jet energy scale" is a calibration factor between the energy measurement in real events and in simulated ones. For a simple explanation see my "Jet Energy Scale for Total Beginners" post from a couple of years ago; also available a part two on the same topic)]
Among these measurements come to mind the search for rare top quark decays, the measurement of the W helicity in top decay, and the measurement of the CKM matrix element
 . However, today I wish to write of another measurement -one which is quite recent in the landscape of investigations of top quark properties. I am talking about the direct and indirect determination of the top quark natural width,
  .
.The Direct Measurement By CDF
In the standard model the natural width of the top quark is proportional to the third power of the top mass, and its value is predicted to be 1.26 GeV for a top mass of 173 GeV or so. Such a natural width implies that the top quark decays in a fraction of a trillionth of a trillionth of a second: although width and lifetime are one the inverse of the other, there is no chance to determine the latter directly. Instead, we can try to measure the former by studying how the reconstructed masses of top quarks distribute around their average value.
When one reconstructs the mass of the top quark from a kinematical fit to the observed energies and angles of jets and leptons in the detector, one is subject to fluctuations in the measurement of these complex final state objects. A 50-GeV b-quark will be reconstructed in the calorimeter as a jet of particles whose total energy might be estimated to be around 50 GeV; yet five GeV less or more -a relative error of 10%- are not improbable. So the resulting value of the top quark mass inferred on an event-by-event basis is quite a wide distribution, too. Its observed width is typically of the order of 20 GeV, id est again some 10% of its mass. Can we discern a 1.26 GeV intrinsic variation in the parameter we estimate, from such a smeared distribution ?
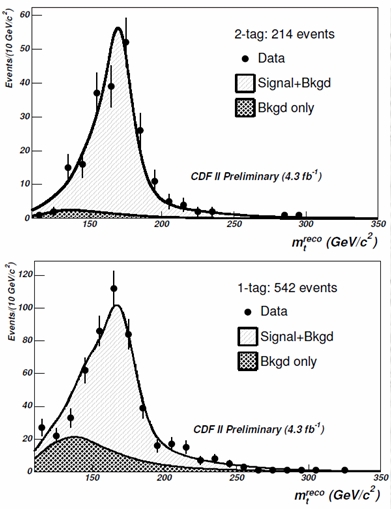 At CDF they show us that we can. They select well-reconstructed single-lepton decays of top pairs (ones where a top decayed to three jets, and the other decayed to a lepton-neutrino-jet trio: quite like the event shown in the CMS display above), and the divide them according to the number of identified b-quark jets they contain. Events with two identified b-quark jets have very little background, because most processes mimicking top quark pair production do not involve the emission of bottom quarks. From a statistical standpoint it is convenient to separate those "double b-tagged" events from events where only one b-jet is identified. The mass distributions are shown in the figure on the right (1-b events above, 2-b events below). Experimental data for the reconstructed top mass is shown by full points, background is the hatched curve, and the signal is the empty curve on top of it.
Although looking at the above distributions we might argue that we do not care where the peaks exactly sit, given that for an estimate of the direct width we only care to examine in detail the shapes of the histograms (i.e., how wide the peaks are), the jet energy scale is still a concern. A wrong scale would worsen our capability of fitting with precision the distribution. In this analysis therefore CDF adopts the by-now standard method of constraining the jet energy scale on an event-by-event basis, by fixing the mass of the two jets attributed to the decay of one of the two W bosons to the well-known value of the boson's mass. This is what is called "in situ" energy scale constraint.
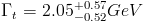
From mass fits, the top quark width is measured with a rather large error bar - the measurement quotes a 68% confidence level interval of 0.3 to 4.4 GeV. However, I still think is remarkable that the natural top quark width can at all be measured directly!
The Indirect Measurement
And what does DZERO does ? They use a different method, and make use of an entirely different top production mechanism: single top quark production, which proceeds by the exchange of a W boson, and whose rate depends significantly on the partial width of the top quark in its decay to W boson and bottom quark. Maybe I should explain here that one can think the total width of a particle as the sum of many contributions, each due to a different possible decay of the particle.
By combining the information on the partial t->Wb width with another measurement they perform of the fraction of times that top quarks actually decay in that final state, DZERO computes the total top quark width as
 , a very precise determination. The price to pay for this precision is however that the measurement ends up depending on a few theoretical assumptions.
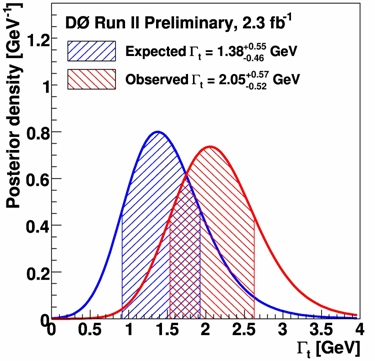 The figure on the left shows the probability distribution function of the width measured by DZERO. The measurement (red curve) comes up on the high side of the expectation (blue curve), but is still perfectly well compatible with the standard model expectation of 1.26 GeV.
It is interesting to note that while the direct CDF measurement will not be too easy to perform by the LHC experiments in the near future -ATLAS and CMS first need to understand their jet energy scale calibration and resolution well-, the indirect measurement should be easier to do. That is due to the very large cross section for single top quark production in LHC 7 TeV collisions, which will grant a much easier access to the partial top width. I expect that one inverse femtobarn will be enough for the CERN experiments to indirectly test the top width to a significantly better level of precision.


Comments