Banner
    More SUSY Forecasts From Recent ATLAS Results
    By Tommaso Dorigo | March 10th 2011 07:50 AM | 16 comments | Print | E-mail | Track Comments
    About Tommaso

    I am an experimental particle physicist working with the CMS experiment at CERN. In my spare time I play chess, abuse the piano, and aim my dobson...

    View Tommaso's Profile

    Readers of this blog know that I often discuss here the latest results of searches of Supersymmetric (SUSY) particles -nowadays furthered by the CDF and DZERO experiments at the Fermilab Tevatron collider, and by the ATLAS and CMS experiments at the CERN LHC.

    The game of limit-setting on SUSY parameters has been very recently taken over by the LHC experiments, which both published their first results on 35 inverse picobarns of 7-TeV proton-proton collisions. While 35/pb are less than a hundredth of the data already collected at the Tevatron, the LHC's x3.5 larger nominal center-of-mass energy is all what matters as far as producing heavy bodies is concerned  (forget the difference in projectiles -hitting protons with protons or protons with antiprotons is just the same thing at these energies, since what is going on is simply that a stream of quarks and gluons hits another stream of quarks and gluons: only electroweak processes do tell the difference, but the overwhelmingly dominant strong interactions do not).

    Now, it would have been quite easy to make a meta-prediction before the startup of the LHC: very soon, theoretical papers would appear, living on the constantly updating lower limits on sparticles that the new energy regime would enable. And it is in fact happening. Already a few groups have started to analyze the results of ATLAS and CMS, to produce global fits that include the new experimental information in an attempt to provide "weather forecasts" for SUSY.

    I recently hosted in my blog a piece by Ben Allanach, one of the authors of such studies. In his witty guest post Ben explained how the CMS data could change the probability density functions (PDF)  of sparticle masses, for instance. Of course, such PDFs only exist if SUSY is a correct theory of Nature (the bitch, not the magazine), so a sceptic could well ignore them. Well, I happen to be a sceptic of SUSY -I even bet $1000 against it a few years ago, and the bet still stands- but let us not ignore them instead. So I will just mention the publication, a few days ago, of a second study by Ben Allanach and his group.

    Ben's group studied the recently published result by ATLAS in this new paper. Now, I need to make a short diversion, to explain in a tone that does not look apologetic why the ATLAS result is much more constraining than the CMS one in the space of SUSY parameters -driving Ben's interest in a quick re-analysis.

    ATLAS and CMS both studied the "gold-plated" signature of SUSY at hadron colliders: missing transverse energy and hadronic jets. This signature is the most frequent outcome of the production of SUSY particles in a wide chunk of parameter space. That is because squarks and gluinos are the SUSY particles endowed with colour charge, and are thus produced most copiously in hadronic collisions. When they decay, they produce quarks and gluons, together with other sparticles that eventually decay into a lightest sparticle, the neutralino. The neutralino remains there, incapable of turning into anything lighter (we are assuming conservation of R-parity here, the quantum number that is one for SUSY particles and zero for normal particles: the lightest R=1 particle then is perfectly incapable of turning into anything else), and due to its properties it escapes the detector unseen, generating observed missing transverse energy. There you have it: missing energy and jets.

    Why then, if ATLAS and CMS looked at similarly-sized datasets, and if they are similarly sensitive to jets and missing energy, did they produce significantly different results on this search ? Well, because of two things. Or maybe three. Diatriba mode on.

    One: the ATLAS search was more aggressive than the CMS one. While CMS relied on a very robust variable to search for SUSY-like excesses, ATLAS used the available information more thoroughly, gaining a bit of sensitivity over CMS. Not much, just a little bit. Confidence wins over conservativeness, 1-0 for ATLAS.

    Two: CMS happened to see an excess of events - a insignificant one, perfectly compatible with backgrounds; but still an excess, which made their limit on SUSY particle production rates looser than it could have been. On the other hand, ATLAS saw generally fewer events than they predicted by standard model sources alone, and this, when you are not going to be able to claim a discovery, is actually a bliss for a HEP experiment: the rate limit you get is tighter. Luck wins, 2-0 for ATLAS.

    Three: ATLAS used a rather questionable method for limit setting. They somehow resurrected a frequentist method that had been abandoned 25 years ago, a method that has at least two caveats, and which produces a significantly tighter upper limit with respect to any of the three PDG-endorsed methods for limit setting. CMS resorted to the CLs method instead -which, while not the best one on the market, is indeed one of the trio of advised PDG methods. The more aggressive ATLAS method produced a tighter limit on SUSY parameters: 3-0 for ATLAS.

    If you are familiar with how uncertainties add up in quadrature, or just with Brownian motion, you know that three random effects usually cancel each other. In this case, the three effects acted in concert and pulled in the same direction, and the result is that ATLAS was able to produce much tighter limits than CMS in this round of the battle.You can see it in the figure below: the ATLAS limits are in red, the CMS limits in black. Note how the ATLAS observed limit is above the expected limit: this is due to their observing fewer events than expected.

    Ok, diatriba mode off. Now, about the new paper in the arxiv. The authors examine the ATLAS result in detail, and they show quite a display of patience in using all the available experimental information released by ATLAS in order to produce meaningful inputs to their global fit of SUSY parameters in the CMSSM model. Indeed, these days experiments should release their likelihoods (or similarly basic information) together with their abstracts and preprints, if they want to enable theorists to do their work. Alas, we are not yet at that point. Indeed, Ben and company spends a few pages of their article explaining how they "extrapolated" the missing information out of the data available. So one point should be drawn here: experiments, please release more information about your measurements!

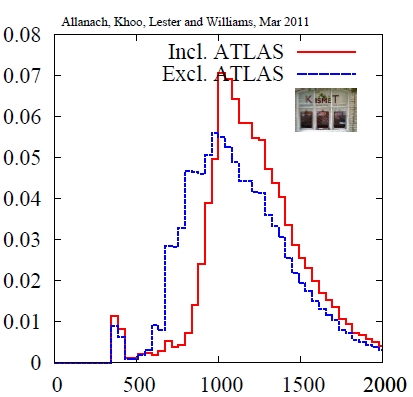
    In the end, the global fit produces improved "forecasts" for the mass of sparticles, if you buy the particular version of SUSY that is of liking of the authors. For instance, let us look at the PDF of the gluino mass before and after the inclusion in global fits of the ATLAS limits (see right): the fit excluding (blue) and including (red) the new result produce a significantly different distribution, obviously shifted to higher mass. No surprise -higher gluino masses makes these particles harder to produce even in the powerful 7-TeV collisions. But fear not: the LHC will produce about 50 times more data in the next few months, and much of the available parameter space will be scanned with such large datasets.

    Comments

    Why do you show the the ATLAS 1-lepton plot rather than the ATLAS 0-lepton plot to support your three-part argument? Is it because the expected limit in fig3 of the 0-lepton paper

    http://arxiv.org/pdf/1102.5290v1

    is way beyond the CMS expected limit, and so showing that plot would weaken your arguments? It seems odd to me that you use a plot that compares the ATLAS 1-lepton limit to the CMS 0-lepton limit, since 1-lepton limits were never "supposed" to be better than 0-lepton ones at crude reach. It seems to me that you ought to compare 0-lep with 0-lep? Perhaps I misunderstand the comparison you are making.

    Another thing that confuses me, is that you seem to think the atlas 0-lepton limit benefited from the fact that it saw ferwer events in three of the four channels it used. This seems to me to miss two important things: (1) the atlas systematic errors were so huge that the effect of the deficits were not very significant (see fig 3 of http://arxiv.org/pdf/1102.5290v1 and note how small the shift of the observed from the expected limit is relative to the +-1 sigma movements) and secondly, and mroe importantly, (2) at each point in the sugra exclusion plane of ATLAS, only *one* of those channels was used to determine the exclusion. That means at most *one* deficit or excess is contributing at each point in that plane. That is why, for example, the MT2 excess causes the fig2 CMSSM limit at large gluino mass to dip below the expected in the ATLAS 0-lep paper -- it is not that the MT2 excess has managed to overcome the three MEFF deficits -- it is becase only the MT2 limit was in use in that part of the plot. So there is not a big "brownian motion" effect of lots of deficits helping each other -- on the contrrary, at each point in those plots there is either one deficit helping, or one excess hindering the limit. This significantly weakens your point two.

    The real reason the ATLAS and CMS 0-lep results differ, is your point "one". They did very different things. alphaT gets rid of QCD, while what it does with SUSY signals is somewhat down to happenstance.

    dorigo
    Hi Christopher,

    putting the wrong figure up there was a mistake, driven by rush. I apologize for the confusion and thank you for spotting it. I will change it now, but the switch does not change my arguments much: there were three effects at work. The ATLAS limit was above expectation (if not by 1-sigma, let's say 0.3 sigma-lucky) because of downward flukes, the CMS limit was below because of upward flukes. The analysis was more constraining in ATLAS. And the method for limit setting is one that has been abandoned by the field 25 years ago, and is too aggressive (and it undercovers in some cases).

    But by mentioning the huge systematics, you have opened my eyes to another issue I had with this plot, namely the very wide range of expected results. ATLAS has the -1sigma expectation at squark masses of 500 GeV, and the +1-sigma expectation at squark masses of 800 GeV. There is a huge variation of cross section implied by these different mass values, and I wonder whether the "expectation band" was computed correctly, i.e. by assuming that the limit is computed with the same systematics which are used in the actual result. Can you clarify ?

    Cheers,
    T.
    dorigo
    Also, I looked at the figure which shows which region among A,B,C,D is used to derive the actual limit, as you mention. The figure is the one shown below (if I did not make another mistake!).


    As you well see, region B (which is the one which overfluctuated) is never the one used in the actual limit near the boundary. Which is obvious, since the observed limit (red curve) is indeed above the blue hatched one (expected limit curve). So by mentioning the four regions and the fact that one of them actually overfluctuated you are just casting smoke on the issue - my observation was correct: one of the reasons for the higher ATLAS limit is that they observed fewer events in the relevant search boxes.

    That said, I must say I am not in the least interested in bashing ATLAS in order to make CMS look good. All I am actually interested in is pointing out that the ATLAS statistical method for limit setting is based on a technique which has fallen in desuetude. I believe it will be changed soon.

    Best,
    T.
    When I was referringto region B driving the limit it was in fig 2 -- the CMSSM plot -- at the bottom right -- not fig 3.

    The fig 3 boundary is indeed driven mostly by D (though not its interior, exclusively).
    The fig 2 boundary has contributions from many signal regions, which is why fig2's limit undershoots at high gluino mass.

    Sorry - typing fast - must dash

    You are correct that I have not addressed the stats issue of CLs vs non CLs.. This is in part because I would like to have my facts straight before I weigh in one way or the other. I don't want to say something I cannot back up -- lest I muddy the waters unintentionally -- and not least of which, I cannot attest to fully understanding *exactly* what CMS did [ignorance].

    I will say, however, that I am satisfied that the ATLAS technique has (if anything) gone overboard by being, wherever possible, conservative in how it has assigned uncertaintes, and that any over assignment of uncertainties lowers the limit.

    This is in part why the "spread" between +-1 sigma is so large, and why the agreement of expected and observed limits may appear "fortuitously" close together. Any over-estimation of an uncertainty will have a tendency to bring the observed and expected closer together relative to the +-1 sigma.

    Note that if ATLAS were to "shrink" its uncertainties below the sizes it is currently comfortable quoting, what would happen is this: the +-1 sigma band's "width" would shrink, AND the position of the expected limit would push out further towards high mass (except in regions where signal region B was used, where the reverse movement would take place).

    So, perhaps paradoxically, the wide +-1 sigma width band is actually "reassuring". It tells you that, if anything, the ATLAS analysis is conservative.

    It is true that it does indicate that if ATLAS uncertainties are "bang-on" (not over estimates) then the limit could have fluctuated up or down, potentially. But that is not a "bad" thing -- that is just a consequence of setting frequentist limits -- you will always get a worse limit if your data fluctuates up, and vice versa. Also, it should be noted that the "interior" of the excluded region has contributions from all signal channels at one point or another, so though region D happens to drive the edge position, an over-fluctuation in region D would not have lead to a great "collapse" ... regions A,B, and C are used in the interior and would have taken over control of the (reduced) boundary.

    Don't get me wrong - I'm not saying that there is anything "wrong" or "bad" about alphaT. It's just that alphaT is one thing, and atlas used four different things to make its exclusion plot (and choose one particular member of that list of four for each position on the plot, based on which ATLAS thought would be the best variable to use there).

    It seems to me not surprising that with four different "tools" available to it, ATLAS was very likely to set a better limit -- in effect it did four different analyses and combined them. If ATLAS had only used one of its channels, say 3jMEFF>500, then it would have got a similar reach to CMS as the back-up plots on the web show. The main reason it did better than this, was that it wasn't tied to using just one variable hoping for a one-size-fits-all solution to exclusion. It used different variables and different cuts on them for different types of SUSY signal.

    Even theorists ;) are asking experiments to use different cuts for different signals ...

    http://arxiv.org/abs/1102.5338

    There is no "magic" to the difference in the exclusions, no "fault" with CMS, no specific "kudus" to ATLAS. As soon as CMS produces a result that has as much specifisity to signals of different types, I am sure they will get a reach that is as good as ATLAS's (+- stat fluctuations etc). It just happens that CMS hasn't done that (yet). What CMS has produced, is a very nice one-size-fits-all search, which has produced a very nice result within the limits/constraints that it imposes on itself, of restricting it to trying to deduce everything from one variable, alphaT.

    dorigo
    Hi again Christopher,

    one thing about your "huge systematics": the boundary is dominated by region D, which has statistical and systematical uncertainties equal (2.5+-1+-1). So your quoting huge systematics as a means of dismissing the impact of downward flukes does not apply there... But admittedly we are talking of small effects. I should rather blame CMS for having been unlucky!

    As for the rest: I concur that it is a bit silly to discuss "luck" when there is a clear difference in the power of the two methods (and ups and downs of each, although the ATLAS one is indeed more sensitive overall).

    As for the statistical tools: you are wrong in saying you do not know what CMS did. CMS used a method that is well-known since the LEP era (CLs, one of the three methods recommended by the PDG), so you should know what that is. Mind you, CLs is by no means the ultimate frequentist method: it has issues, and Feldman-Cousins would be a clear improvement. On the other hand, the ATLAS method is not documented in the literature. It is, however, based on a "diagonal line" approach at getting confidence intervals, a practice which has been abandoned 25 years ago for good reasons.

    On the conservativeness: maybe the systematics that ATLAS placed make the overall result conservative - I cannot assess that from the outside; but the limit-setting method is certainly not going in that direction.

    That said, I must also say I appreciate the ATLAS result and I hope that CMS will perform soon an analysis using similar techniques. But the most important thing is that CMS and ATLAS will need to agree on the statistical procedure!

    Cheers,
    T.
    You say of me: "you are wrong in saying you do not know what CMS did".

    Please do not underestimate my ability to know my own mind, and particularly its limitations. Of all people, I'm propbaly in the best position to be the judge of what I don't know.

    If I say I don't know X, it need not be interpreted as a failure of someone else to explain X, it may simply be an indication that I am have not yet taken the trouble to read the description of X sufficiently carefully or in sufficient detail to yet feel I know all about X.

    I will re-assert, without implying failure or limitation on the part of anyone other than myself, that I *still* do not know the full details of how CMS went about using the CLs method. This is because I have been concentrating on other things, not because CMS has failed to explain itself properly, and not because CLs is not well documented.

    Aside:

    I still do not wish to be drawn into a debate about CLs vs other methods of interpreting results here, since (at least to my mind) that is a matter that is wholly separate, and is a debate that could be had in connection with results of all kinds, not just these SUSY ones. Personally I am much less interested in that debate, than I am in getting out into the public domain the core results (i.e. the data counts, the BG extimates and their uncertainties) from which those interpretations are drawn. That way people who are sufficiently interested can take our experimental data and form their own conclusions about it, using whatever technique they prefer.

    However well documented, it always takes me a long time to unpick the statistical techniques and assumptions used when collaborations of all colours present results. The devil is always in the detail, and I think that debates that are held between parties of whom not all are 100% on top of all of those details, can be fraught with dangers / cross-purposes-discussions etc.

    Why do the LEP limits for m0 extend beyond 1 TeV when LEP has a much lower collision energy?

    Thanks
    Paul

    dorigo
    Hi Paul,

    the m0 in the plot does not correspond to any physically observable mass of SUSY particle. Think of it as just one of the (many) parameters of the particular SUSY theory used to construct the plot above. LEP searched for particles it could produce, of course, and their observed absence was used to exclude points of this multi-dimensional parameter space. Projected onto m0, and for specific chioces of the other parameters, this means some exclusion, as displayed.

    Cheers,
    T.
    rholley
    Off-topic, but I have just been reading the Telegraph’s obituary of Simon van der Meer.  The link to it says:
    Scientist who detected the particles that prevent the sun from overheating
    How does one make sense of that?
    Robert H. Olley Quondam Physics Department University of Reading England
    Plus they seem to think that the Nobel Prize in Physics is awarded by Norway rather than Sweden.

    dorigo
    Hi Robert,

    sorry for the very late reply - about the overheating, I agree it's just b******t. The commenter got carried away in his attempt to trivialize the matter.

    Cheers,
    T.
    I tend to agree with Christopher Lester, that the interesting differences between the ATLAS and CMS results lie with the different approaches rather than with the statistical methods. Of course, "interesting" is a subjective criterion. Anyway, if you want to read a comparison of the two analyses with no diatribes and virtually no discussion of statistical issues, see my blog: Comparing the ATLAS and CMS Searches. Although Tommaso's discussions may be more expert, especially as regards statistics, my comments are not redundant with his. ;)

    At least in my viewer, the link to "Comparing the ATLAS and CMS Searches" in the post above seems to be missing the destination url. I think the intended url would be: http://muon.wordpress.com/2011/03/06/comparing-the-atlas-and-cms-susy-se...

    I would just like to throw my support behind the request for more information from experiments. Making the full likelihood functions available for download would be much appreciated. Also, it would be much appreciated if the likelihood functions over slices of model space other than tanB=3, A0=0, mu>0 could be published. Even better, the likelihood function over the full parameter space. I realise this last would require some fairly stupendous computing to do properly, but even something rough would help a lot, especially combined with a few slices done in higher resolution.
    Once you get that far, it would be nice to see these functions for other constrained MSSM models :). There you go, that's 3 or 4 papers for you right there :).
    Also someone should start an online repository of this kind of data. This is the digital age! There is some cool stuff that could be done if this information was available, more robust stuff too. Buchmueller et al (1102.4585v1) and Ben Allanach et al (1103.0969v1) wouldn't have to dodgy up an approximation to the likelihood functions themselves then.

    dorigo
    Hi Ben,

    that's reasonable. And nowadays with RooFit/Roostats one can directly share the so-called "workspace", which has all the needed information.

    There are other instances in which it would be advisable to publish more information. For instance, in studies employing unfolding matrices, these should be produced too. Unfolding is a very tricky thing, and some methods are just plain bad. More disclosure of the data is important there too.

    Cheers,
    T.