

So, CMS did the same exercise that I described a few hours back discussing the ATLAS searches for the Higgs: they combined all their results, obtaining their own version of the "Brazil band" plot, which summarizes the upper limit on the Higgs boson production rate, in Standard Model predicted units, as a function of the unknown Higgs boson mass. More details on the way the plot is constructed can be found in the former post. Here is the CMS result:
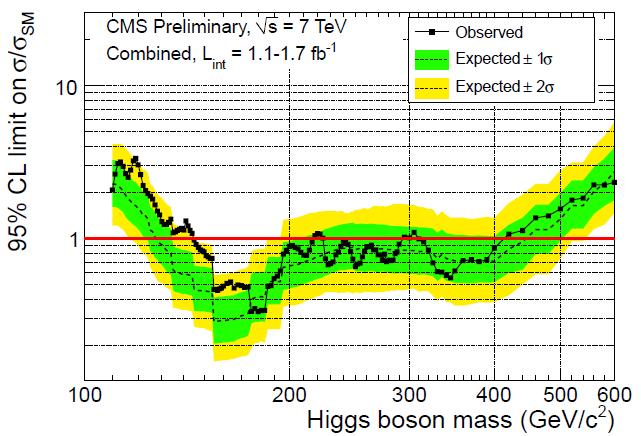
As you can see, CMS excludes a wide region of Higgs boson masses, using up to 1.7 inverse femtobarns of collision data (a bit less than the one used by ATLAS in some of its searches). The quoted 95% confidence-level limits say that the Higgs is excluded in the range 145-216 GeV, 226-288 GeV, and 310-400 GeV. This result is marginally less sensitive than that of ATLAS, and the difference is in part due to the fact that CMS observes some mild excess of events in some parts of the mass range: in particular in the hot region around 140 GeV, where you can see the black curve lurking out of the yellow "two-sigma" band. Not to worry: if one accounts for the multiple places where an excess might have appeared, given the broad range of the investigated masses, the probability of observing an excess as significant or more in the data is just 40%...
The other view of the results is provided by the figure below, which I however hesitate to comment, since it is a bit complex. The upper part of the figure shows the local p-value of the observed fluctuations in the various analyses, as a function of Higgs mass. As you see ,there are two places where the fluctuations reach 2-sigma level -but this, as stressed above, are local significances, and an accounting of the many places where the signal is looked for is not included.
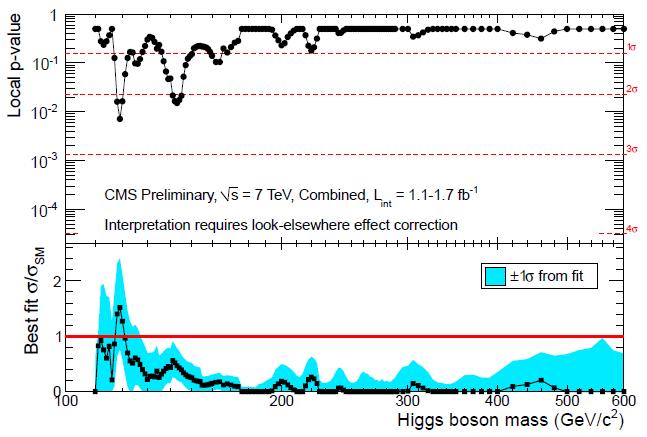
In the lower half of the figure, the most interesting piece of information: the "best fit" of the signal rate provided by the data, as a function of mass. Here you see that the fluctuation at 140 GeV is less than half as strong as it would be expected to be, if a 140 GeV Higgs existed. More interesting is the local fluctuation at 120 GeV, where the strength of the signal is just about right; however, we are really discussing ridiculously insignificant effects for the time being: we need to be patient, and wait for a reload of these analyses based on 5 inverse femtobarns of data, which the LHC is going to produce by the end of the year if all goes well. With three times more data in the CMS analysis, and 2.5 times more in the ATLAS analysis, plus the inclusion of additional search channels, the total power of the LHC data, once combined, should be able to tell us much more than we can get now. So stay tuned!


Comments