The Eyjafjallajökull eruption also differs from most of the well studied eruptions, in that Eyjafjallajökull represents a less active volcano. Most of what we know about volcanic eruptions comes from highly active volcanoes such as Hawaii. Eyjafjallajökull represents a moderately active volcano, where there repeat times between eruptions vary from 200-500 years. There is a good chance such volcanoes will behave differently from more active volcanoes. For example, their plumbing system should be cooler, and this could change the way magma travels from depth to the surface.

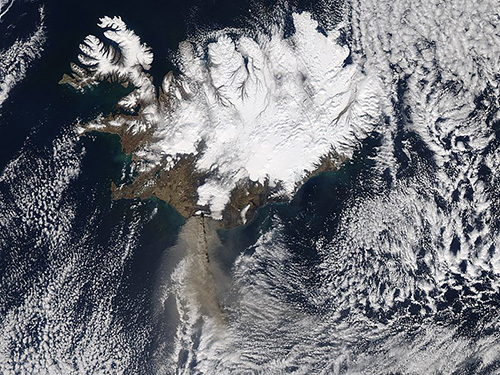
Ash plume from Eyjafjallajökull Volcano, taken by the Aqua Satellite on the 14 April 2010. Credit: NASA/GSFC, MODIS Rapid Response.
So first, lets recap the events of the summer. The eruption began in March with the rather gentle fire fountaining at Fimmvörðuháls, on the flank of the main volcano. A few weeks after that activity had petered out came the main event, the large plinian eruption that grounded most European flights (including the one we were supposed to catch back from a field trip in southern Spain, leading to a 35 hour bus journey). However, unrest at the volcano had begun much earlier, with seismicity picking up in 1992 after 20 years of quiescence (since monitoring started).

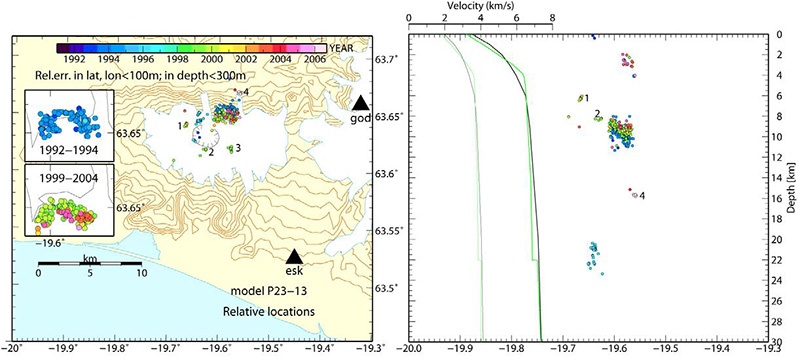
Seismicity under Eyjafjallajörkull between 1991 and 2006. Taken from this report (pdf) from the Icelandic Met Office. The lines in the diagram on the right is the velocity model used to calculate locations, and represents the assumed velocity of seismic waves with depth.
The picture above shows the earthquakes whose locations are most accurately known, on the left in map view, and on the right as an east-west cross section. The colour of the points varies with their time, blue earthquakes occurred closer to 1991, pink closer to 2006. The path the magma took to the surface is clear, as is the way it stalled at several levels in the build up. There were two major swarms, one in 1994, the other in 1999-2000. These probably represent two major intrusions of magma from depth.
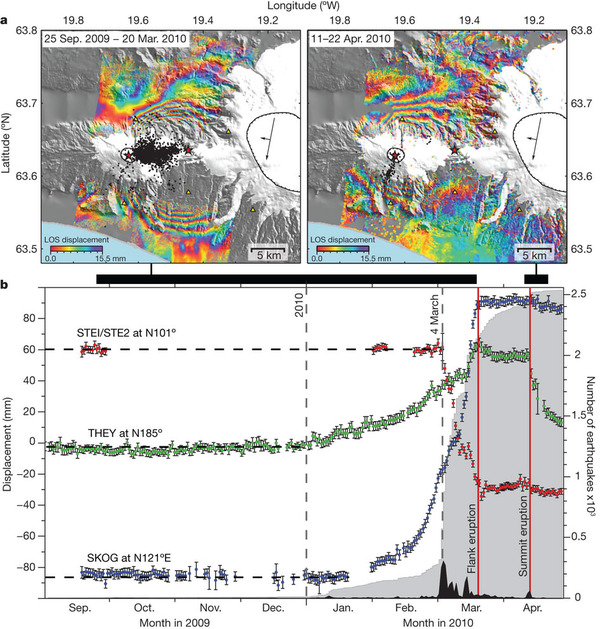
Another common precursor of eruptions is deformation, and it is this that the Nature paper concentrates on. Starting in mid-2009, the volcano underwent a period of 'inflation'. Inflation often occurs at volcanoes, as fresh magma is intruded beneath them. Sometimes this leads to an eruption, other times the magma stays put. This can be measured regularly using GPS sensors and tiltmeters, as well as over a large area from space using InSAR (a fascinating technique I may write about in future). The GPS sensors placed on Eyjafjallajörkull provide a detailed record of the timing of deformation, while InSAR images allow the spacial pattern to be measured.

Deformation of Eyjafjallajörkull. a: InSAR images, each fringe (from red back to red) is an increase in displacement of 15.5mm towards the satellite. b: Displacement data from selected GPS stations. Taken from Sigmundsson et al.
In Eyjafjallajörkull the magma eventually made it to the surface. Usually, this leads to deflation, as the magma chamber empties. However, as seen in the diagram above, this didn't happen. Instead, there was very little deformation during the Fimmvörðuháls eruption. This suggests that magma supply into the chamber from deep matched the magma that erupted at the surface. The larger summit eruption did lead to deflation, although the picture is complicated by the fact that the source for the deflation was not in the same place as the source for the inflation.
Finally, the composition of the erupted magma has been quite informative. The Fimmvörðuháls eruption was basaltic, with a silica content of ~48%. However, the magma from the summit eruption was more silicic, (~57% silica). This is one of the reasons the summit eruption was more explosive, although the interaction with the ice cap was perhaps more important. Such a large change in the composition of the magma could explained if the incoming magma mixed with leftover magma from a previous eruption. Initial chemical analysis shows that it could have mixed with magma from the 1821 eruption, the last time Eyjafjallajörkull blew. It is increasingly being found that mixing of old and new magmas occurs beneath many volcanoes, and this fresh injection of hot magma often triggers an eruption. It is this process that I am investigating on Santorini, which makes this data particularly interesting for me.
If you enjoyed this, you may enjoy my twitter stream...
Reference:
Sigmundsson, F., Hreinsdóttir, S., Hooper, A., Árnadóttir, T., Pedersen, R., Roberts, M., Óskarsson, N., Auriac, A., Decriem, J., Einarsson, P., Geirsson, H., Hensch, M., Ófeigsson, B., Sturkell, E., Sveinbjörnsson, H.,&Feigl, K. (2010). Intrusion triggering of the 2010 Eyjafjallajökull explosive eruption Nature, 468 (7322), 426-430 DOI: 10.1038/nature09558


Comments