

I am speaking, of course, of the Standard Model (C) Higgs boson, the only one which exists (maybe). Fancier concoctions, predicting five, eleven, or exp(pi) new scalars will be reviewed another day when I am under drugs.
\begin(short introduction)
To the benefit of the few of you who need an introduction, here is one: the Higgs boson, H, is a particle with the quantum numbers of the vacuum, a particle thought to provide all other massive bodies with the right amount of "inertia" by interacting of the latter as they propagate in empty space. H has never been detected in subnuclear experiments yet, but physicists have a pretty good idea of what its properties are: if it exists, and if the Standard Model is ultimately correct (although incomplete, yeah), then the existing data on the properties of massive particles contain some information on it.
Indeed, through the comparison of precise measurements and theoretical predictions, we even know what the Higgs mass should be, albeit with some still sizable uncertainty. The mass of the Higgs boson is a crucial input to experimental searches, because it dictates how frequently the Higgs boson is produced, and even more to the point, how it disintegrates, and thus what are its decay signatures.
Right now physicists in CDF, DZERO, CMS, and ATLAS are searching Higgs signals in no less than a dozen different final states: pairs of W bosons, pairs of Z bosons, pairs of photons, pairs of b-quarks, pairs of tau leptons, pairs of top quarks. Also, these signatures may arise by themselves, or in association with additional b-quarks, or additional W or Z bosons, or additional top quarks. The mess is complete and thorough.
\end(short introduction)
So let me make a few points on the Higgs search, maybe for the last time before the particle is eventually found, or more likely, for the last time this spring. First of all, what do we know from existing searches and indirect limits ?
When I want to discuss the above question, I remind myself that like the way the GFitter folks display this information. I must say it is slightly questionable to put together indirect and direct search inputs, combining probabilities as one would do with a poker hand: or rather, the combination is valid but we must be extremely careful in its interpretation. Yet the succinct message of the figure below has its undeniable appeal:
The green curve shows a statistical estimator, a "delta chisquared", as a function of the unknown value of the Higgs boson mass. The higher the curve goes, the less likely the corresponding mass is. The calculation of the curve includes all electroweak fit results, along with direct search results. The minimum of the curve shows the most probable value of the Higgs mass, but don't be deceived: any value in the range 114-160 GeV is in good agreement with the inputs.
The grey areas should in my opinion have different colours in the two regions: they shows areas "excluded" by the LEP II (left) and Tevatron (right) experiments, but the LEP II bound is just soooo much stronger than the Tevatron one, it is almost deceiving to show them on the same footing. But then again, the curve is the important information here -and you see it from the curve: it skyrockets to impossibly high delta-chisquared values for Higgs masses below 112 GeV. If you were to take home one bit of information from this graph, it would be this: the Higgs is heavier than 112 GeV. On that you can bet one testicle, if you have any (betting two would be too daring for my own taste).
Now let me show just one recent result - the ATLAS combined limits, which they put together using data collected in 2010. These are still sizably less stringent bounds than the ones produced at the Tevatron, but this for sure is the last time that it is so... ATLAS is currently sitting on about 20 times more data, and by the end of June they will have about 50 times more overall (my very own prediction), so expect the bound shown here to go down all of a sudden by a factor 7 or so, without warning. But this only if the Higgs is not there!
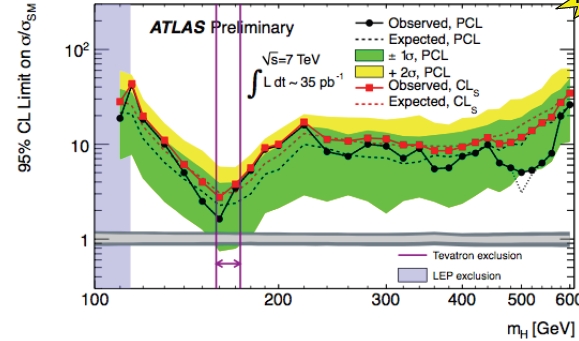 Ok, and what is there in this plot ? The y axis shows the rate of production of Higgs bosons, in units of the Standard Model expectation. The line at 1.0 is indeed the reference point. To read this graph you should focus on a particular Higgs mass value - say 160 GeV, which corresponds to the leftmost purple vertical line of the Tevatron exclusion. If you go to the intercept of the purple line with the black "french fit", you get to read the rate which ATLAS could exclude, in SM production units: roughly 2. ATLAS is thus saying "if the Higgs boson has a mass of 160 GeV, its production rate is less than twice as high as the one predicted by the Standard Model". A similar sentence can be constructed for any Higgs mass, using the black line to provide the correct rate limit.
Users familiar with Higgs boson limit plots might be slightly confused by the additional information that this busy plot displays. Where is the other part of the "Brazil band" ? The green and yellow regions of the plot display some interesting additional information, in fact -the green band frames the rate limits that the experiment expected to set, 68% of the times. That is to say, if the experiment were repeated, with 1 million different 35 inverse picobarns datasets, at each Higgs mass ATLAS would end up with a limit within the green band about 680000 times. The yellow band instead frames the region where 970000 limit points should fall.
So where is the lower part of the yellow curve ? It is not there because of the way ATLAS has decided to construct their limits. They use a "power-constraint" prescription, whereby if the data fluctuate over one standard deviation below the background expectation, they ignore the actual data and report instead the limit they'd get if the data was exactly at minus one sigma.
I have discussed elsewhere the pros and cons (mostly cons) of this doubtful procedure, which does not cure the problems of the statistics which ATLAS uses to derive the limit for all values above minus-one-sigma (this is the so-called CL_sb, if you are familiar with LEP-II results). Here, however, is a good time to show that the limit setting procedure favoured by ATLAS is less conservative than CL_s (which is also displayed on the same figure, in red). CL_s, too, has issues. Stuff for another post.
Apart from statistical masturbations, what else do we get from the ATLAS result ? I think it is clear that all LHC results on the Higgs search are, and will be for some time, dominated by the statistical power of their data. But the data, as I said, is increasing fast. So if you were to take the red (or black) curve above and move it down by a factor of seven or so, you would have a very good representation of the future results, which should be available in the matter of two-three months. We are in excited times: ATLAS alone will exclude a large part of the available phase space... And CMS will do that too.
(If you are too lazy to move the curve down by heart, you can always give a look at the projections that ATLAS made a few months ago, here). Ok, ok, too lazy to even click ? Then see below. The region between the black and blue curve is more or less where the ATLAS limit will lay in a few months.
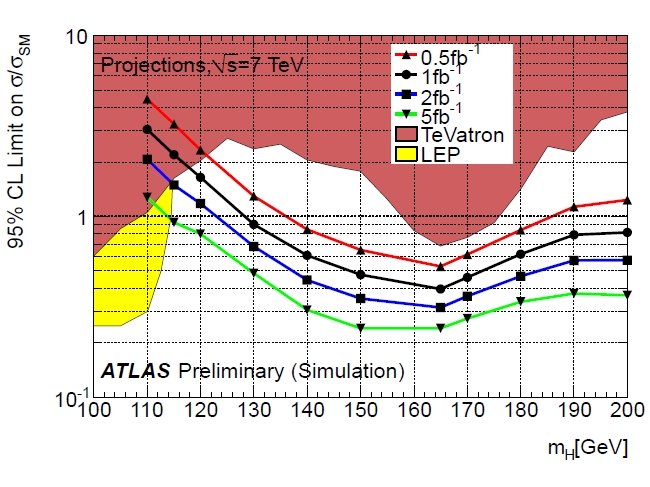 So we are looking at a wiping off the board of all Higgs boson masses above 125 GeV! I can't wait...
Comments