

The problem of choosing a parametric model that is able to capture the observed features of experimental data is an old and ubiquitous one. Actually, it is even more common than we would like to admit, as we often brush it off by approximating the distribution of data with simple, well-known functional forms, arguing that those are good enough for our analysis purposes. Alas, in so doing we may be committing atrocious crimes, that come back to haunt us when we later forget about that assumption and start to derive faulty conclusions on the properties of the data.
There are many reasons why we can fool ourselves when we pick a model to interpret some data, but the most common one, which I have observed countless times in my peer (and at times also in myself, although I have by now got some sort of a vaccine shot against it) is a tendency to overfit. We value the message that the data is trying to give us, so if we see some feature in the data we try to give it meaning, by choosing a model that is flexible enough to include it and explain it.
Let me give you the following example, which is taken from a lecture I give to graduate students in my course of Statistical data analaysis. Imagine you have data distributed in ten bins of some relevant variable, and you want to extract a guess of their underlying probability distribution - the model. In this very simple example the data are rather imprecise - as evidenced by the wide uncertainty bars. In this graph there is also plotted a red line showing a fit of the data to a constant, but ignore it for now.
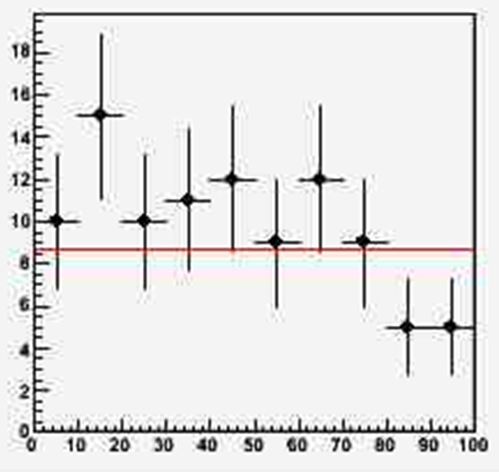
[Let me open a parenthesis before we continue: the way the data are displayed in the above histogram gives a lot of information, as plotting bullets with uncertainty bars does two things at once: it provides information on the counts in each bin, AND it provides information on the estimated 68.3% confidence-level intervals around the individual frequencies in each bin, in a frequentist sense. In other words, the bars yield an interval around the estimate of the true frequencies in each bin, where the latter are of course coincident with the observed ones. Although I realize this is a bit too technical a detail for this post, you are welcome to comment or discuss it in the thread below.]
One way to proceed is to consider a class of models of higher and higher complexity, each "embedded" in the next one (in the sense that the more complex model, for a specific value of one of its parameters, becomes equal to the less complex one), and try them out in turn by fitting the data, checking how good a job they do.
Of course, the more parameters one adds to a model, the more flexible the latter becomes. So in this example we try to fit a constant through the ten points ( f0(x) = A0 ), then try a linear function ( f1(x) = A0 + A1*x ), and then try a quadratic function ( f2(x) = A0 + A1*x + A2*x^2 ). As you can easily see, f0(x) is "embedded" in f1(x) as the two coincide if we take A1=0 in the expression of f1, and f1(x) is embedded in f2(x) as they coincide if A2=0 in the expression of f2. The three functions are a good starting bid to fit our data. Let us see what happens if we do it.
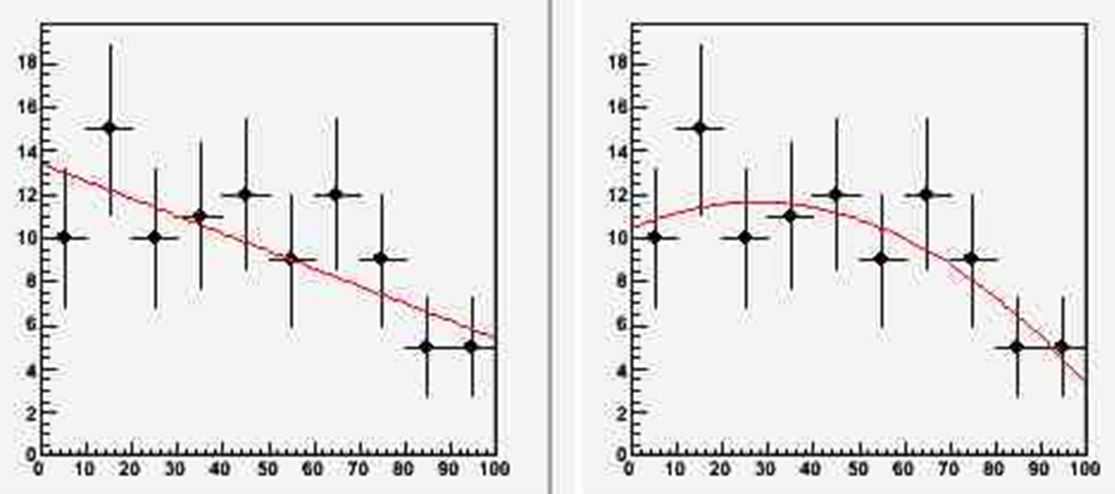
Above you can see the three models (the first is in the previous figure) all seem to do a reasonable job. But which of them would you pick as your true model of the data, if you had to choose? I will give you 10 seconds to answer this, and then you can read on.
...
...
...
When I ask this question to my students, I usually observe that most of them prefer the quadratic model, as it "captures" more features in the vagaries of the data: in particular, the low-lying leftmost point, and the high points on the center-right.
But then I ask them to think at what the meaning of those uncertainty bars really is. While in any specific instantiation they either "cover" the true value of the frequency they estimate or they do not (for we are assuming that the unknown frequency in each bin has a well-defined value), as an ensemble they cover the true values with a 68.3% frequency, because of the way they have been computed. Now, the quadratic model gets to pass through all of the bars! Is it not asking a bit too much to the function?
There is a principled way to deal with this issue, of course. It is the Fisher F-test. The F test can be used to compare two models one of which is embedded in the other. It compares the sum of squared residuals of data minus model in two competing fits, properly normalized by the number of free parameters of the two models. This becomes a number, call it F, which belongs to a Fisher distribution if the more complex model is unnecessary.
A hypothesis test procedure can then be used to decide whether to accept the more complex model or not. As with any hypothesis test, you will be required to first define a type-I error rate (AKA test size), say 0.05: this is the fraction of times that you allow yourself to exclude the "null hypothesis" (that the more simple model is the correct one, e.g.) when in fact it was the correct one. Applied with a size of 0.05 to the data at hand, the test determines that the linear fit f1(x) is a motivated extension of the constant fit (as the probability that the computed F is drawn from a Fisher distribution is 0.01, i.e. less than 0.05); and it also determines that the parabolic fit f2(x) is not motivated, as the probability that the corresponding F is drawn from a Fisher distribution is of about 0.10.
Overfitting is as common as it is dangerous. Always ask yourself the question: do 31% of my uncertainty bars fall out of the model or not? If much fewer points miss the model than 31%, then the function has too many parameters!
---
Tommaso Dorigo is an experimental particle physicist who works for the INFN at the University of Padova, and collaborates with the CMS experiment at the CERN LHC. He coordinates the European network AMVA4NewPhysics as well as research in accelerator-based physics for INFN-Padova, and is an editor of the journal Reviews in Physics. In 2016 Dorigo published the book “Anomaly! Collider physics and the quest for new phenomena at Fermilab”. You can get a copy of the book on Amazon.


Comments