Banner
By Patrick Lockerby | July 22nd 2010 03:32 PM | 13 comments | Print | E-mail | Track Comments
About Patrick

Retired engineer, 60+ years young.
Computer builder and programmer.
Linguist specialising in language acquisition and computational linguistics...

View Patrick's Profile
Arctic Ice July - Update #4

Once again my focus is on Nares Strait.  This time I want to show how glaciers can be affected indirectly by sea ice.

There are two major glaciers in the Nares Strait - Petermann and Humboldt.  Both are primed for calving.

Although glaciers are many times thicker than sea ice, sea ice can slow calving of some glaciers.  Ice is very strong in compression, so a sheet of fairly thick and consolidated sea ice can exert a backforce on a glacier sufficient to reduce the calving rate even if by only a small amount.  Sea ice can restrict the expansion of melange.  During the winter the sea ice exerts a back-pressure on the calved bergs, which freeze into a compact melange.  The melange in turn exerts more back-pressure on the glacier than would sea ice alone.  This is especially true in fjords and bays.

As I reported in Arctic Ice June 2010, in August 2007 Nares Strait was choked with ice.


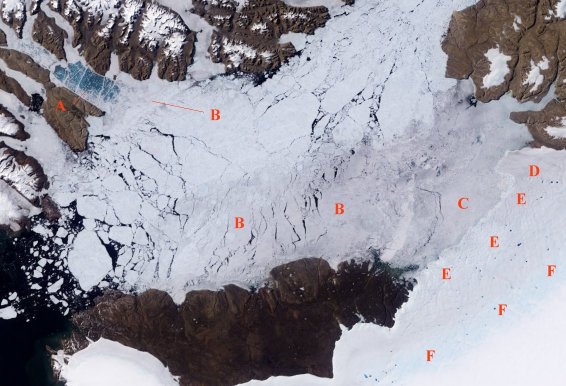
Ice in Kane basin, Nares Strait, August 2007.

Note the Humboldt Glacier ice tongue at D. 
Note also the white line of compressed bergs between C and E.


Compare the August 2007 image with Nares Strait as of July 22 2010: there is a lot less ice now, a month earlier in the season.


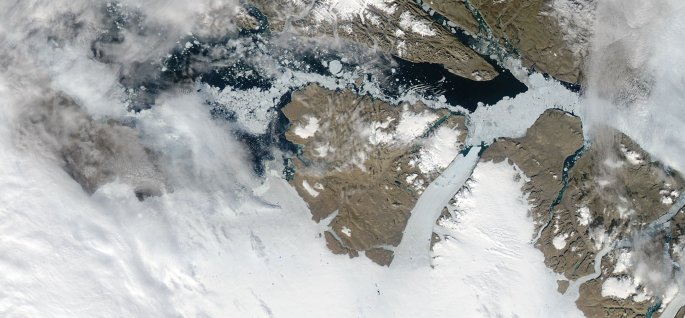
Nares Strait July 22 2010

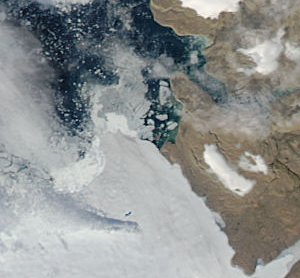
There was a lot of thick ice in the Kane Basin from winter.  In the next image you can see a white margin of bergs from 2009 around the Humboldt Glacier calving front.


Humboldt calving fronts June 18 2010

The left arrow points to the Humboldt main calving front arc.  The right arrow points to the calving front of the tongue.  Between the arrows a loose stream of icebergs is trapped in the sea ice.

The next image shows just how much melange consisting mainly of bergs is released from having been pressed back by the sea ice.


Humboldt Calving fronts July 22 2010

Now that the back-pressure has been released we should see some calving front retreat any time soon. 


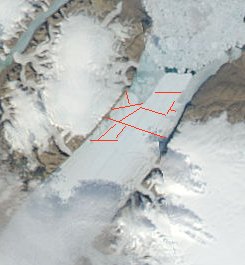
The Petermann ice tongue looks primed to lose a few fairly large floes any day now.  There are a lot of cracks showing at 250m resolution.  That means the cracks must be at least 250m wide.


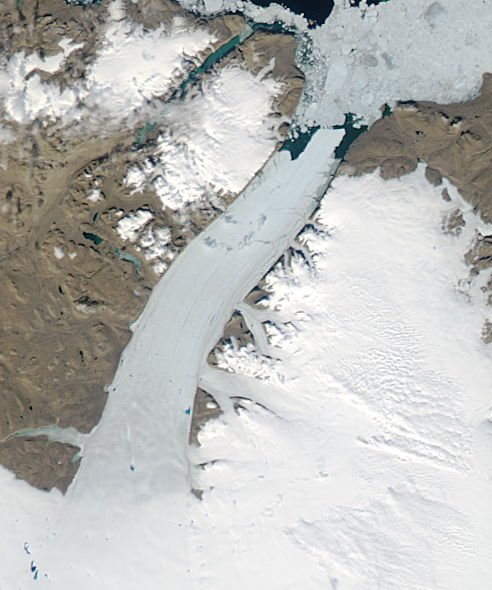
Petermann Ice tongue July 22 2010

You may wish to compare the image above with my prediction in Arctic Ice July 2010 - Update #3.

It looks like a few small bergs- about 2 or 3 km across - are going to break off before the main tongue breaks up.  The bigger fracture back at the tributary glaciers needs a lot of back-pressure relieved before it can expand much.


Projected breakup of part of Petermann glacier tongue.

The Petermann ice tongue tip has held almost the same shape since winter 2008.  It has had nearly two years in which to thin and crack.  I would be very surprised if it does not retreat substantially this year.

---------------------------
Related / further reading:

http://neven1.typepad.com/blog/
http://glacierchange.wordpress.com/2010/03/27/petermann-glacier/
http://www.meltfactor.org/blog/?tag=petermann-glacier
http://climatechangepsychology.blogspot.com/2008/12/images-of-sermersuaq...
http://earthobservatory.nasa.gov/IOTD/view.php?id=9085

Credit:
Images courtesy MODIS Rapidfire:
http://rapidfire.sci.gsfc.nasa.gov/

Comments

Hi Patrick. Thanks again for your continued excellent work. Is there any knowledge about the position of the grounding line for Petermann Glacier? This seems central to the question of sea level rise.

Thanks again, love your Blog. It's "must" reading!

logicman
Hi, Artful Dodger.

I did post a reply earlier, but it seems to have evaporated.  I must have hit the wrong button.
Here goes again:

The length of tongue in 2008 was 80km.  It hasn't changed much since, flow into the tongue is quite slow as these things go, and there has been no significant calving.

Based on that length, and the appearance of slopes and other features in the MODIS images I would put the grounding line about where I show it in this image:


Petermann Glacier probable grounding line.

The other red arrows show where I would put the effective limit of lateral compression.  Downstream of that point the ice is not strongly pressed against the walls of the fjord, and so is quite vulnerable.

The green arrows point to what look to me like recent fissures.  I would need to see other sharp images to confirm that they are not shadows or image processing artifacts.  However, the tongue thins substantially from grounding line to tip and will have been thinning since September 2008, so a breakup of the tip this summer is quite likely.

If I come across a base topography map of high enough resolution or a definitive report of where the grounding line is,  I'll post it.

Hi,

I was looking at MODIS terra R2C03 today (205) and I was wondering about a peculiar feature under what appears to be the clear ice of the exit of 79N, which I believe you said we should watch out for should the shore ice melt back that far. To my untrained eyes, there seems to be a dark "river" visible running under the ice. Am I imagining things, is this an artifact, or is there some other explanation? I'm guessing that all the melt water from the bright blue melt pools above has got to emerge somewhere and this looks like the likeliest spot. If I am right, what do you think will be the impact for this glacier?

Whoops, that should have been Zachariæ, not 79N!

logicman
Greg: thanks for the question.

Here's a quick tip for checking MODIS images for artifacts: for any mosaic image or part, just click 'prev' and see if the previous day's image shows the same feature.

Here's the relevant portion for mosaic 204 - July 23 2010:

79N and  Zachariæ

To the right and below the two calving fronts marked CF is sea ice.  The arrow middle top points to what is most likely a boundary between glacial streams, with fissures at right angles to it.

Meltponds come in all shapes and sizes: see the 'tadpole' and ring at left.  When the meltwater tunnels down to the bottom of the ice you have a moulin.  Meltwater can also stream along the surface.  Most meltwater streams are too narrow to show up at the 250m resolution.

At the right of the Zachariæ main calving front is a dark line extending about 90 degrees to the main glacial flow.  I think that it's an artifact of human vision and is most likely an accidental alignment of similar bergs in the melange.

Was that the line you were referring to?


Recommended related reading, especially the update:
http://dotearth.blogs.nytimes.com/2008/07/03/a-tempered-view-of-greenlan...

Thanks for your post Patrick ... and I really like your blog btw!

I'm afraid I don't know the correct format to post pictures in html on this site ... the feature I was referring to in today's image is what looks like a wide darkish smudge which starts just above the line between your two green CF arrows and extends a little way down past the rock adjacent to the "F" in "CF". I'm afraid that although I cropped an image to post here, my knowledge of the HTML format required to post images is inadequate ... it's on http://4.bp.blogspot.com/_x7l8qPmufOc/TEttf3MbtSI/AAAAAAAARCk/b0OkUV9wH8... if you can see it, for what it's worth. Having seen some small dark clouds to the north, I suppose that this could be shadow, as it would appear to require a really large (and sudden) release of water for this to be a moulin ?

logicman
Greg: sorry to be a bit slow in responding.

The bluish color in your image is a cloud shadow.


If you check out the band 3-6-7 image you can see the cloud and its shadow:

http://rapidfire.sci.gsfc.nasa.gov/subsets/?subset=Arctic_r02c03.2010205...

Thin clouds are often almost invisible in mosaic images, but the shadows tend to show up as blotches.

The grounding line is just a bit to far upglacier I would say based on velocity data and the surface rouhgness , more on the upstream edge of the tributary from the north side. I do not see the rifts shown by green arrows as new, when looking back at last years imagery, what are you seeing that I am not.

logicman
Mauri: thank you for visiting my blog, and welcome.

I'm happy to take your suggestion as to where the grounding line is.  That would be the blue arrows in this updated image?


Here's a blink animation of July 22 2009 and 2010, using these images:
Arctic_r03c03.2009203.terra.250m.jpg
Arctic_r03c03.2010203.aqua.250m.jpg


This detail shows what I think I am seeing:

Red arrow points to a chunk which appears to be in process of separating.  There appears to be a new fissure across the two older fissures at this point.

Magenta arrow points to an area which seems smaller and more fractured than last year.

Blue arrows point to what appear to be recent fissures.  The uppermost one in the image may be an artifact.  I'm waiting for a fresh cloud-free image to compare with.

Green arrows point to where I would expect to see fissures developing soon. 

I would greatly appreciate your views on these observations.

Hi Patrick,

You didn't comment on my observation of the large visible open sea area north of Nares Strait and Petterman, and on "top" of Greenland width +100 km length ?, which is easily spotted on the Modis images. But is not to seen on any other datas I have seen, why is that not seen elsewhere? Regards Espen

logicman
Espen:  was that your recent question here?  I seem to have missed answering, sorry.

There is an area of open water called the N.E.W. polynya - North East Water polynya - which tends to remain open regardless of the state of the ice in the general area.


Image from Arctic Ice July 2010 - Update #2


location of N.E.W. polynya

I hope the article  Arctic Ice July 2010 - Update #2 answers your question.  If not, please feel free to ask more questions.

The 2010 image has much better relief-shadows showing obviously from a different time of the day. I am not convinced that the rifts are much expanded. They have clearly shifted down fjord a bit. Certainly the ice tongue is more exposed and the connection to the fjord walls less iced in at the very front. Given the level of rifting a breakoff seems likely, but this is such a slow moving glacier, that the rifts which would ordinarily spell immediate trouble do not here.

logicman
Mauri: yes, of course differing shadow angles can exaggerate apparent differences in images.  I hadn't considered that.  Once again: thanks for the input.  I'll continue to check the MODIS images as often as the cloud isn't in the way.

As for the speed, or lack of it, this glacier seems to be a good example of what 'glacial' speed means.

Add a comment

The content of this field is kept private and will not be shown publicly.
  • Allowed HTML tags: <sup> <sub> <a> <em> <strong> <center> <cite><TH><ul> <ol> <li> <dl> <dt> <dd> <img> <br> <p> <blockquote> <strike> <object> <param> <embed> <del> <pre> <b> <i> <table> <tbody> <div> <tr> <td> <h1> <h2> <h3> <h4> <h5> <h6> <hr> <iframe><u><span>
  • Lines and paragraphs break automatically.
  • Web page addresses and e-mail addresses turn into links automatically.
CAPTCHA
If you register, you will never be bothered to prove you are human again. And you get a real editor toolbar to use instead of this HTML thing that wards off spam bots.