Banner
    Arctic Ice July 2010 - Update #3
    By Patrick Lockerby | July 17th 2010 07:26 PM | 16 comments | Print | E-mail | Track Comments
    About Patrick

    Retired engineer, 60+ years young. Computer builder and programmer. Linguist specialising in language acquisition and computational linguistics....

    View Patrick's Profile
    Arctic Ice July 2010 - Update #3

    An update and a bit of Arctic history.

    Despite the extensive cloud cover over much of the Arctic it is possible to see some interesting patterns of behavior.

    Around the Siberian side of the Arctic the ice has already retreated from shore or is in process of retreating.  The same goes for the Alaskan and Canadian shores as far as Prince Patrick Island.  Ice in the fjords and passages from the Beaufort Sea to Nares Strait is melting.

    From Prince Patrick Island to the Nares Strait, ice is being pressed inshore.  Ice is also pressed inshore from Nares to Flade Isblink.  In the Nares Strait itself and the Lincoln Sea, winds continue to hold up the ice export.  These winds are local and are blowing from Ellesmere Island.  These are most likely katabatic winds, in which case they will promote melting.

    Past the Petermann Glacier some ice in the Kane Basin is pressed inshore - presumably by the same katabatic wind - but other ice is still exported.

    The Petermann Glacier

    Judging from historic maps and images, the normal behavior of the Petermann ice tongue was the formation of a concave front at the fjord mouth.  Over recent years it has retreated.  Much of the tongue is now detached from the walls of the fjord.  Tidal forces will flex the tongue up and down: wind, currents and ice floe impacts will all exert at least a small lateral force on the tongue.  It will continue to thin from melting.

    Judging by previous behavior and by the forces which will act on a more mobile ice tongue, I predict some dramatic calving this year.  The image below shows red lines where I expect the tongue to calve.  This is based on moraine and meltwater channels seen in other images from last year, and previous calving.  Please note that this is more of an educated guess than a scientific forecast.  Although there is a large fracture further upstream, it is quite old and may well be healed with solid ice.  That part of the glacier is in compression across the fjord, which will - I suggest - reduce the likelihood that the fracture will grow - until it has move a substantial distance such as to relieve the transverse compressive forces.


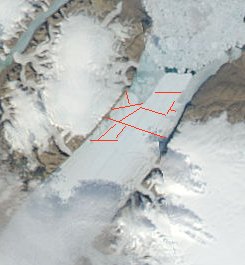
    Petermann Ice Tongue

    The whole Nares / Petermann / Lincoln Sea area is currently under cloud.  It will be interesting to watch the area when the cloud disperses.


    Fram Strait

    The amount of ice lost through Fram Strait depends on a number of factors.  The two most important factors would seem to be fragmentation and gap width.  Fragmentation is important because floes which are so large that they can't pass through are going nowhere.  The gap width is important in that the smaller it is, the smaller floes have to be before they can pass through without jamming.  Back when the shorefast ice around Greenland and Svalbard was perennial ice, the passage between the two lots of shore ice and the pack was quite narrow.  The map below, published in 1939, shows permanent ice as white, and perennial pack as white with blue crazing.


    Arctic ice 1939
    .
    The map shows what was considered to be an average minimum ice extent in 1939.  Note that the edge of the shore ice and coastal pack ice extends south to Cape Farewell.  For the most part the east coast of Greenland was long considered unreachable by sea.  The area around Flade Isblink had been surveyed by sledge teams about 1918.  It was re-surveyed by air by Lauge Koch in 1938.  His maps show a larger Flade Isblink ice cap than today and extensive shorebound ice.

    Lauge Koch flying over a glacier in N.E. Greenland

    The reason we know so much about the state of the Arctic in the 1920s and 1930s is simple: science was politicized.  The nations carrying out these surveys were vying with each other for national prestige.  They were also interested in the military and strategic value of the Arctic.  Scientific ideals are fine, but they don't pay for scientific research.  Unfortunately, as today, politics and science don't mix too well. 

    For example, both Lauge Koch and Umberto Nobile were attacked in the press, but for different reasons - none true.  Koch was accused of making false claims about his maps; Nobile was accused of incompetence and cowardice.  Nobile's airship Italia had crashed on the ice in May 1928.  The icebreaker Krassin rescued the last of the 'red tent'1 survivors on July 12 1928.
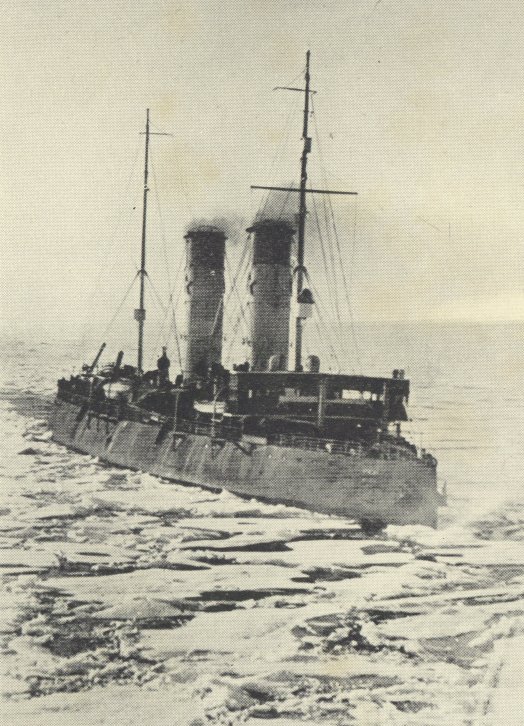

    Icebreaker Krassin

    The map shows the North Eastern Route along the coast.  The map shows average ice edge.  The route was never continuous: icebreakers were needed to force a path through different areas in different years.  My article  Arctic Heroes #2 - North Pole 1 mentions icebreakers being stuck in the ice near the New Siberian Islands.  The reason they got stuck is that they had gone to the rescue of eight freighters which were trapped in the ice between The New Siberian Islands and the Kara Sea.  On looking at the lack of ice this summer in those areas, and the temperatures, it is hard to imagine so much ice there in 1937 as to trap three icebreakers and eight freighters.


    New Siberian Islands temperatures July 15 2010 - MODIS image.


    The Kara Sea today shows some very interesting features:

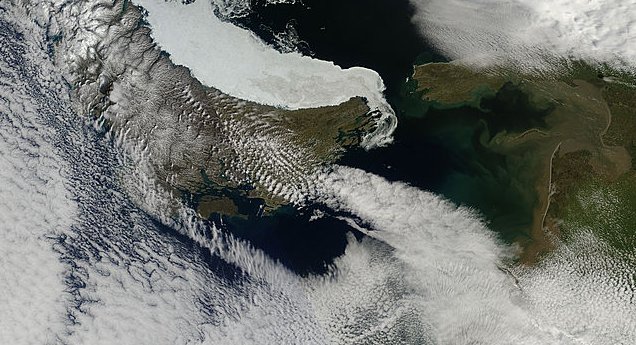
    Kara Strait July 17 2010 - MODIS image.

    It is normal for a sea route to open either in the Kara Sea or on the other side of Novaya Zemlya in the Barents Sea.  Both routes are open sea this year: no ice-breakers required.  Note the algal blooms - a sign of relatively warm waters.

    In the image above you can see thin lines along the shore which look white.  This is not ice.  As ice presses against the shore it builds up in thickness and 'bulldozes' materials into a line of spoil.  This line helps protect the coast from erosion when ice retreats.  When ice forms inside these natural sea walls it tends to last longer than floating ice of equal thickness.


    The Arctic today is substantially different to the Arctic that was extensively explored in the 1920s and 1930s.  It was a lot colder then, with thicker ice.  Small ships could sometimes feel their way through the fringes of the pack, but larger vessels would often be trapped in the ice: even icebreakers.

    To be continued ...


    Related articles can be found in The ChatterBox Arctic Index

    -----------------------------------------------------------------------------
    [1] - the so-called red tent wasn't red - that was just the newspapers getting their facts wrong in the days of black and white photos.  I hope to cover the Italia story soon in another article.

    Comments

    Thanks again for a great post.

    The 1939 map is interesting. It shows seasonal pack ice as far south as Labrador.
    The Labrador coast has been cleared for quite a while and it's looking like the entire
    Baffin Bay will be clear in a few weeks.

    Also, interesting comment about the width of the Fram Strait being a function of how
    much land fast ice there is on Greenland and Svalbard.
    From the Cyrosphere today site, it looks like Svalbard has no coastal ice and
    an open stretch of water is forming directly across the Strait on the coast of Greenland.
    So, the Fram Strait looks to be about as wide open as it can be.

    I'm also noticing the beginnings of some deep blue colors in the mist of the Arctic Basin.
    (I'm beginning to ignore yellow shades as that may be just clouds).
    Anyhow, the deep blue color corresponds to about 60% coverage.
    Not sure how big a pixel is, but I'm guessing it about 10 miles and there are more
    than just a few pixels. Green corresponds to about 70% coverage, and those areas
    are now about 100 miles or so wide. So, the basin is ripe for some drastic reductions
    over the next few weeks.

    logicman
    Andrew:  I think you are right about Baffin Bay being clear soon.  Back in the 1850s there was even more perennial pack ice there than in 1930.

    The central pack has a remarkable amount of open water: well spotted.  I hope to be writing that up soon, together with some historic data.

    Meanwhile, check out the Rapidfire Arctic mosaics.  The link below gives you the current day: click 'prev' to get previous days mosaics.  When you have clicked 'prev' you get a number in the url - just edit that to jump to other days.  Examples below.

    current day:
    http://rapidfire.sci.gsfc.nasa.gov/subsets/?mosaic=Arctic

    July 17
    http://rapidfire.sci.gsfc.nasa.gov/subsets/?mosaic=Arctic.2010198.terra.4km

    June 12

    http://rapidfire.sci.gsfc.nasa.gov/subsets/?mosaic=Arctic.2010163.terra.4km

    Here is July 17 2010 mosaic reduced size:
    Andrew Xnn
    ugh! Believe a reply of mine is lost in cyberspace. So, here's a re-creation: Patrick, Thanks for the Rapid fire links. After playing around with it a bit here is what I've found: http://rapidfire.sci.gsfc.nasa.gov/subsets/?subset=Arctic_r04c03.2010182... http://rapidfire.sci.gsfc.nasa.gov/subsets/?subset=Arctic_r04c03.2010188... http://rapidfire.sci.gsfc.nasa.gov/subsets/?subset=Arctic_r04c03.2010198... http://rapidfire.sci.gsfc.nasa.gov/subsets/?subset=Arctic_r04c03.2010199... These are 1km images dated 7/1, 7/7, 7/17 and 7/18/2010. In the first 2 images, there are a few dark areas, that are probably melt ponds. In the 7/17 and 7/18 images, there are larger dark areas that are not melt ponds. Also visible on 7/17 and 7/18 are large chunks of very white sea ice. Not sure of their dimenions, but if 1 pixel=1km, then they are dozen of km across. In between the large which chunks are areas of darker ice and water. I'd guess these areas are 90% ice. However, it's probably significant that this ice condition is not happening along the edges of the main basin. One would expect there to be melting along the peripheral of the basin in the various seas. However, this is happening at what appears to be hundred of km inward. Don't have a sense for how common/uncommon it is for this to happen towards the center of the basin. However, I suspect it's not all that common.
    logicman
    Andrew: the first two images are fairly normal for late summer of any recent year.

    In the late 19th and early 20th centuries explorers reported that the ice was in constant motion.  Leads and polynyas - areas of open water - would appear and disappear.  The difference is that these days there are far more such areas of water, and the central pack resembles the sort of more open and mobile ice that used to be found only along the edges of the central pack.

    In case you missed it, I have been collecting an index of my Arctic-related articles in
    The ChatterBox Arctic Index.

    I wrote a brief series about using the MODIS Rapidfire satellite images in
    MODIS Rapidfire For Citizen Scientists - currently 4 parts.

    I have just today published an article which may be of interest
    Jakobshavn Glacier Second Calving ?


    Enjoy.  :-)
    Hi Patrick,

    I am just wondering, are there any figures about the volume of ice in the Arctic Sea, related to the area. The reason I ask is that I believe, the area of ice at this point compared to recent years is not dramatically smaller, but the quality of the ice seems to be at a very "rotten level". Thanks

    logicman
    Hi Espen: you are quite correct.  The ice is thinning fast - so fast that graphs of volume loss are much steeper than graphs of extent or area loss.

    This is being discussed in a comment thread at Neven's blog:
    http://neven1.typepad.com/blog/2010/07/sea-ice-extent-update-17-crescend...

    Artful Dodger has kindly provided a link to some relevant graphics:
    http://psc.apl.washington.edu/zhang/IDAO/seasonal_outlook.html
    logicman
    Quick update:

    The ice flow from Lincoln Sea into Nares Strait seems to have resumed.  The latest MODIS Arctic mosaic shows a lot of algal bloom - especially around the Petermann Glacier's floating ice tongue.

    Nares Strait - detail at 250m resolution from MODIS image:
    http://rapidfire.sci.gsfc.nasa.gov/subsets/?subset=Arctic_r03c03.2010200...
    Hi Partrick,

    I have a question about the satellite image above from Nasa of Nares Strait etc. Have you noticed the open sea in the north of Greenland, look down in the right corner of that full sized image http://rapidfire.sci.gsfc.nasa.gov/subsets/?subset=Arctic_r03c03.2010200...

    It looks like I should find a ship, and a cruise around Greenland, and become the first to do so in modern time, maybe even forever?

    logicman
    Espen: at the moment the main pack is being pressed inshore between Nares Strait and Fram Strait.  If a shore lead opens, then Greenland will be circumnavigable for the first time in human history.

    I have covered this point briefly in two articles:
    Arctic Tipping Points - #1: Background And Recent History
    Iceberg Alley And Global Warming
    I am curious as to why you focus entirely on using optical images, which can only be acquired successfully by daylight and during favourable weather (i.e. cloud-free conditions). The calving event of 4 August on Petermann is perfectly documented by the Microwave radar of the European Space Agency's Envisat satellite, yet most of the press releases about the occurrence are limited in determining the true timing of when it occurred.

    Long and short of the story: microwave radar imaging instruments, such as ASAR on Envisat ,are the only reliable source of images each and every time the satellite passes over. This provides a robust weather-independent, and perhaps more importantly, year round source of data on ice shelf calving events. This has been demonstrated extremely well throughout the International Polar Year for most large ice shelves which have been disintegrating - such as the Wilkins ice shelf - Antarctica. See "Webcam on Wilkins": http://www.esa.int/esaEO/SEMWZS5DHNF_index_0.html
    Moreover, we have a record of Petermann calcings dating back to the ERS-1 satellite in 1991.

    Notably, microwaves are also sensitive to when melting is actively taking place. Thus one can observe that the downslope katabatic winds and synoptic weather conditions both likely contributed to this event - as well as the fact that warming of the ocean from beneath has caused thinning and weakening.

    logicman
    I am curious as to why you focus entirely on using optical images

    MODIS Rapidfire images are very easy to access in near real-time.  The interface is intuitive and there is a page of images going back to 2002.  The entire planet is covered.

    Any ordinary person can easily access those images.

    On other sites either the interface is not intuitive or else only raw data is available.

    I work entirely alone, am fairly ill and have limited time.  This means that the fewer sites I visit, the less stress I place myself under.

    If there is cloud cover then I have many other things to write about - I don't sit around waiting.

    My focus is on an engineering aspect of the strengths and weaknesses of ice as a material.  No satellite image can show the stress patterns inside the ice.  But true color images can show some surface indications which can be used together with information from scientific papers to predict calving.

    Can you provide a link to a page which displays radar images of the entire planet in near real-time?

    btw, the glacier is named for August Petermann who is often called the father of arctic research.
    There is much valuable data about the glacier to be found in old books and scientific papers.  Modern satellite images stand on that very strong foundation.
    What you say is not true at all.
    Envisat ASAR and MERIS images are also equally available in Near Real Time - as are many other Space Agency images! It is simply a matter of knowing where to look. The equivalent ESA tool for MERIS Rapid Image Viewing is called MERAVI - see here; http://miravi.eo.esa.int/en/ It is equally intuitive....

    However, the best one-stop-shop to search and access the most recent radar and optical images anywhere in the globe is via the common Earth Observation catalogues Web portal (eoportal.org) - which allows geographic searching of all ESA, NASA, DLR, and KARI images - all at the same time!
    http://catalogues.eoportal.org/eoli.html
    Using this tool may view the ESA images alongside the NASA MODIS images you use. The space agencies participate in this effort commonly to try to ensure the widest use of the data. Parochial tools do not give you the benefit of accessing multiagency resources. After all it may be cloud covered when the Aqua or Terra satellite flies overhead - but not when another satellite passes over.

    Good luck in transferring to use of this tool

    logicman
    Good luck in transferring to use of this tool

    I would need it!

    Why do I need to set up yet another account and log in to see images that are, presumably, in the public domain?  Rapidfire doesn't place that hurdle in front of the public.

    Many such sites don't work for me because I do not have the essential plugins and have many layers of security lockdown to protect my computer against viruses, rootkits and hackers.

    Rapidfire uses standard HTML protocols.

    The whole point of having HTML standards is that a person using older software or hardware can access the full content of a web page without the need to install special software.

    When I publish true color images I provide links to the source so that any ordinary person can verify my sources.

    Globally, the majority of web users use obsolete hardware and software.  These people would not be able to see content unless they knew how to add features to their browsers.

    My computer is set up to block content which might pose a security risk and to block content which would not be visible to a user running an older browser in Windows 98.

    Another matter not considered by many web publishers is color-blindness.  A color-blind person is more likely to be able to make sense of a near-true-color image than a false-color image.

    But thank you anyway for trying to be helpful - sincerely.
    Both the web sites provided work with all browsers and neither need registration.
    All you need to do is to have java plugin and to allow popups - since otherwise you prevent ta Java applet from running.
    This is necessary - since the databases are all smart enough to allow your own time/location search criteria to be applied though several catalogues at once (and not a list of images in folders referred to by html pages).
    This limits the bandwidth required by you and all the other of thousands of users using it simultaneously with you.

    You gotta move into the 21st century Bro' and to work with the cloud of data out there!
    I am sorry to say it - but its a lot more than just MODIS Rapidfire - which is not global at all. It is subsetted data over specific boxes on the earth. What if someone is interested in somewhere else......

    Anyway to conclude on this whole iceberg business. The story is now all around the world. So the benefit of having many "so-called" discoverers (who independently use resources like the ones linked) is that the story gets propagated even further. Public awareness is as a consequence raised.

    logicman
    All you need to do is to have java plugin and to allow popups - since
    otherwise you prevent ta Java applet from running.

    You are joshing me, aren't you?
    You expect me to install two features which are widely known - at least by us geeks - to be wide open to exploits?

    Originally, the whole point of Java was that it was a form of sandbox for the protection of computers against malware.  For some reason that I can't fathom, the protection afforded by the sandboxing element has gradually been eroded.

    Popups and popunders are the single most complained about sources of annoyance on the web and are blocked by most computer-savvy users.

    There is no way that I am going to remove my malware protection layers just because someone doesn't know how to design a website which can be accessed by any ordinary web user.

    Rapidfire most definitely does afford global coverage.  Two satellites in opposed circumpolar orbits cover the entire planet every day between them.  Maybe you are only familiar with a subset of their images?

    I am quite aware what century this is.  Now, if only we could get the politicians to understand that simple fact.  :-)

    Anyway to conclude on this whole iceberg business. The story is now all around the world. So the benefit of having many "so-called" discoverers (who independently use resources like the ones linked) is that the story gets propagated even further. Public awareness is as a consequence raised.
    I wholeheartedly concur!  One of the major points of having this web site is to make science accessible to the widest possible public audience.