

The Arctic is currently primed for rapid and extensive ice loss, unless we see some very unusual weather conditions this Summer.
The state of the ice can be seen in the following series of satellite images from NASA's Earth Observing System Data and Information System - EOSDIS. EOSDIS produces near real-time data and makes images such as the Arctic mosaic and the Near Real Time (Orbit Swath) Images available on the web.
The Arctic mosaic is made up of panels arranged as six rows and six columns. Any panel can be viewed in higher resolution by clicking on it. In single panel view, other resolutions are available up to 250 meters per pixel.
Using images from the Arctic mosaic since June 10 2013 - except where clearly noted - I have compiled a 'June 2013 tour around the Arctic'. The 'itinerary' is marked on the image below.
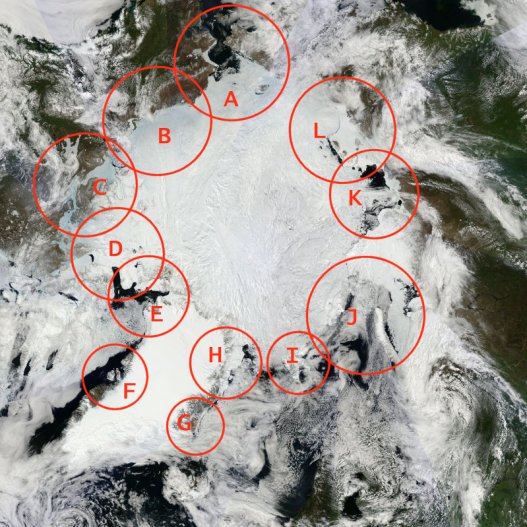
Arctic Mosaic, annotated.
A - Bering Sea and Chukchi Sea

Arctic Mosaic Bering Straits June 2013
The annotations show the regions in the zoomed images below. The satellite images show large areas of open water and of dispersed ice. This is confirmed in the current ice chart from the National Weather Forecast Office, Anchorage Alaska.
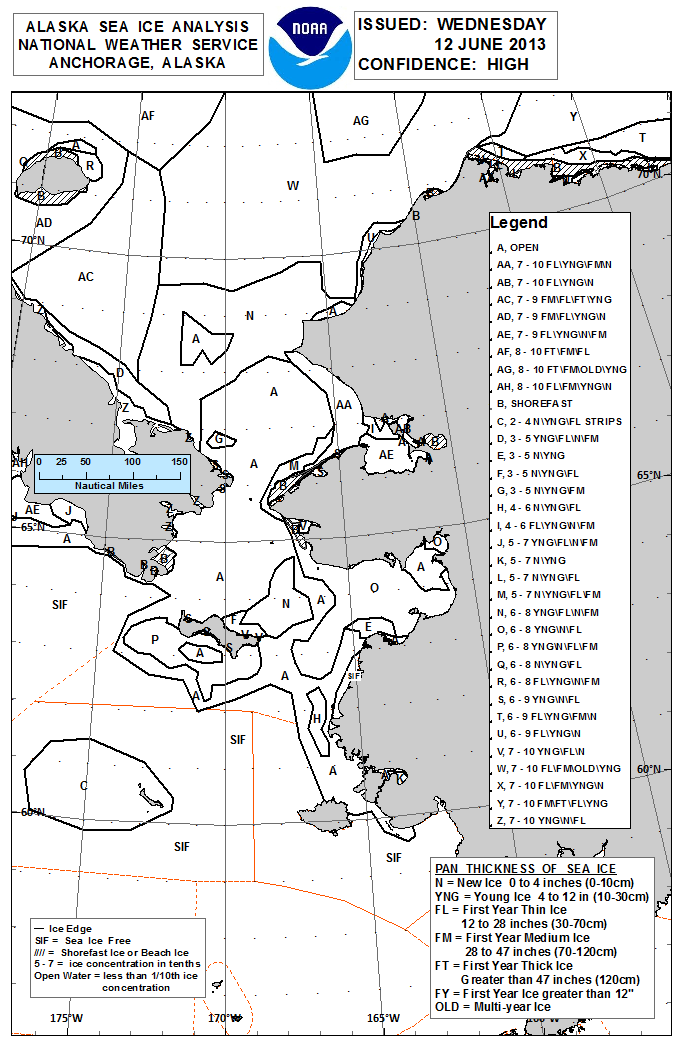
Sea ice analysis June 13 2013
The next image is part of the NSIDC ice extent chart for June 14 2013. It demonstrates the difficulties of using software in determining what is ice and what is not. It also demonstrates that the chart should not be used to report on current ice conditions. It does not discriminate between thick or thin, tightly-packed or loosely-dispersed ice. Comparing the chart with the satellite images shows this clearly.
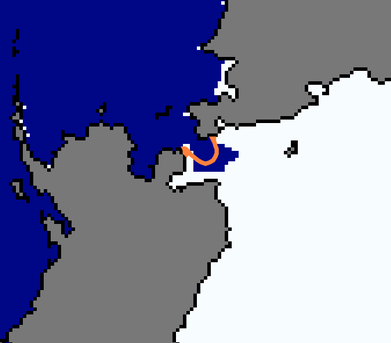
NSIDC ice extent chart.
Much of what appears to be ice in the NSIDC chart is ice smoke - water vapor coming from the melting ice.
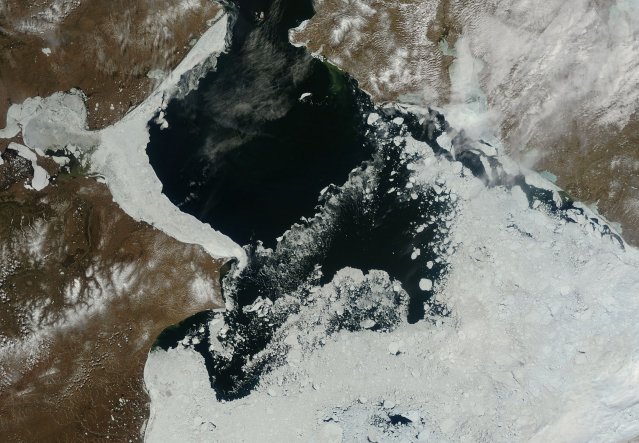
Region 1
Where there is continuous ice, it is breaking up and melting in situ. The ice smoke obscures some ice, but indicates melting.
Region 2
The pack is in motion. Agitation promotes melting of this predominantly 1st year ice, as does tidal current penetration under the ice.
Region 3
Along the Siberian coast in this region is an open lead with broken ice. Less ice smoke indicates slower melting than on the Alaskan side. But it is melting.

Region 4
News from Alaska -
Summer ice melt
Warming Alaska, Canada glaciers send 100 gigatons of ice into ocean each year
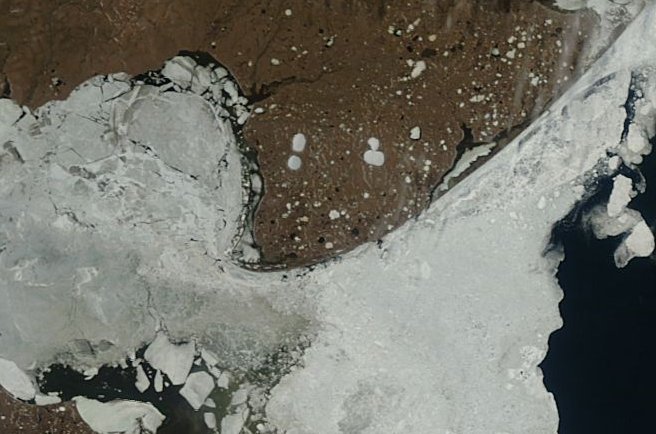
B - Beaufort Sea
The ice in the Beaufort sea retreats from the coast most years, allowing navigation along the coast. Currently extent is a little above average. However, due to persistent losses of multi-year ice the volume is lower than was once normal. The loss of thermal mass will be reflected in a rapid drop in extent as the Arctic continues to warm in the Summer.
Thermal mass is what kept an ice-box cool before the fridge was invented. Ice can absorb heat withoout melting until its sub-zero temperature is raised to zero. The greater the thermal mass, the more heat can be absorbed. The lower the temperature, the mopre heat can be absorbed without melting. When the Winter temperature drop of sea ice is exceeded by the Summer rise, it malts. When the mass is too little to absorb all of the Summer heat, it melts. If we knew the ice volume and temperature we could predict with a great deal of certainty the effect of a normal Summer in reducing the volume.
In the image below we see two polynas. There is meltwater on the shorefast ice.
Meltwater on ice in the Beaufort Sea.
In the image below we can see loose, mobile pack. The lighter colored lines in the shorefast ice, running mostly parallel to the coast are likely to be heavy ridges formed by 'ice shove' as the pack is forced against the shorefast ice.
Pack ice and shorefast ice, Beaufort Sea.
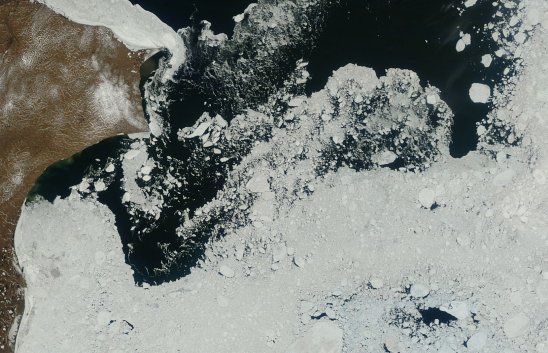
C - Beaufort Sea and Canadian Archipelago
In the next image, from June 15 2013, ice in the Beaufort sea adjacent to the North West Passage is breaking up and dispersing.
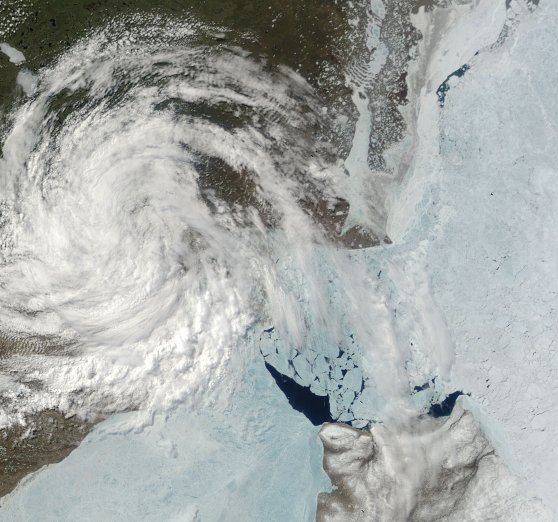
Meltwater and ice breakup in NWP
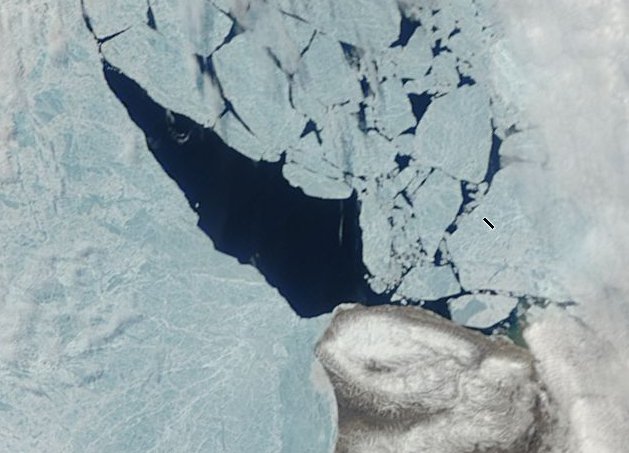
Ice breaking up NWP - detail
D - Canadian Archipelago
As all Arctic aficionados know, most of the (remaining) multiyear ice is pressed up against the shores of the Canadian Archipelago and Greenland.
...
Up till now that multiyear ice that was pressed against the Canadian Archipelago had something to press up to. But as we saw in the first half of August [2010] (check the animation) all of the ice in those channels started breaking up and multiyear ice was transported from the Arctic Basin to lower latitudes where a lot of it melted out. Some of it froze up in the Northwest Passage, which could be a reason the passage is a bit slower in breaking up than it was last year.
Neven, Arctic Sea Ice Blog 2011
Throughout the Canadian Archipelago, floes of older ice are glued together by first-year ice. The volume of older ice has reduced over the past decade or so, meaning that the region has a reduced thermal mass. This means that an ordinary Summer is sufficient to cause the ice to break up rapidly into mobile floes. The images below show regions of particular interest.

The Canadian Archipelago.
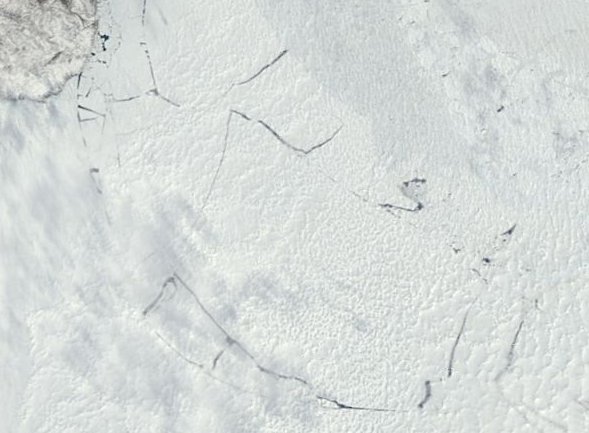
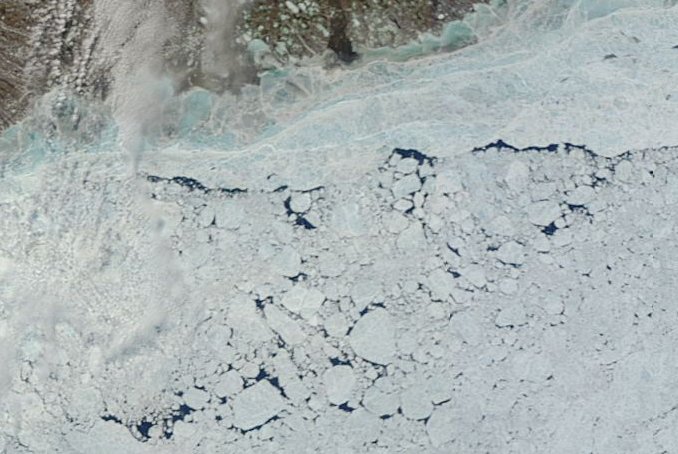
Region 5 - McClure Strait
The ice is breaking into huge floes, but they are held in place by sea ice and land. Further melt in the area will permit motion, with consequent greater breakup and melting of these floes.
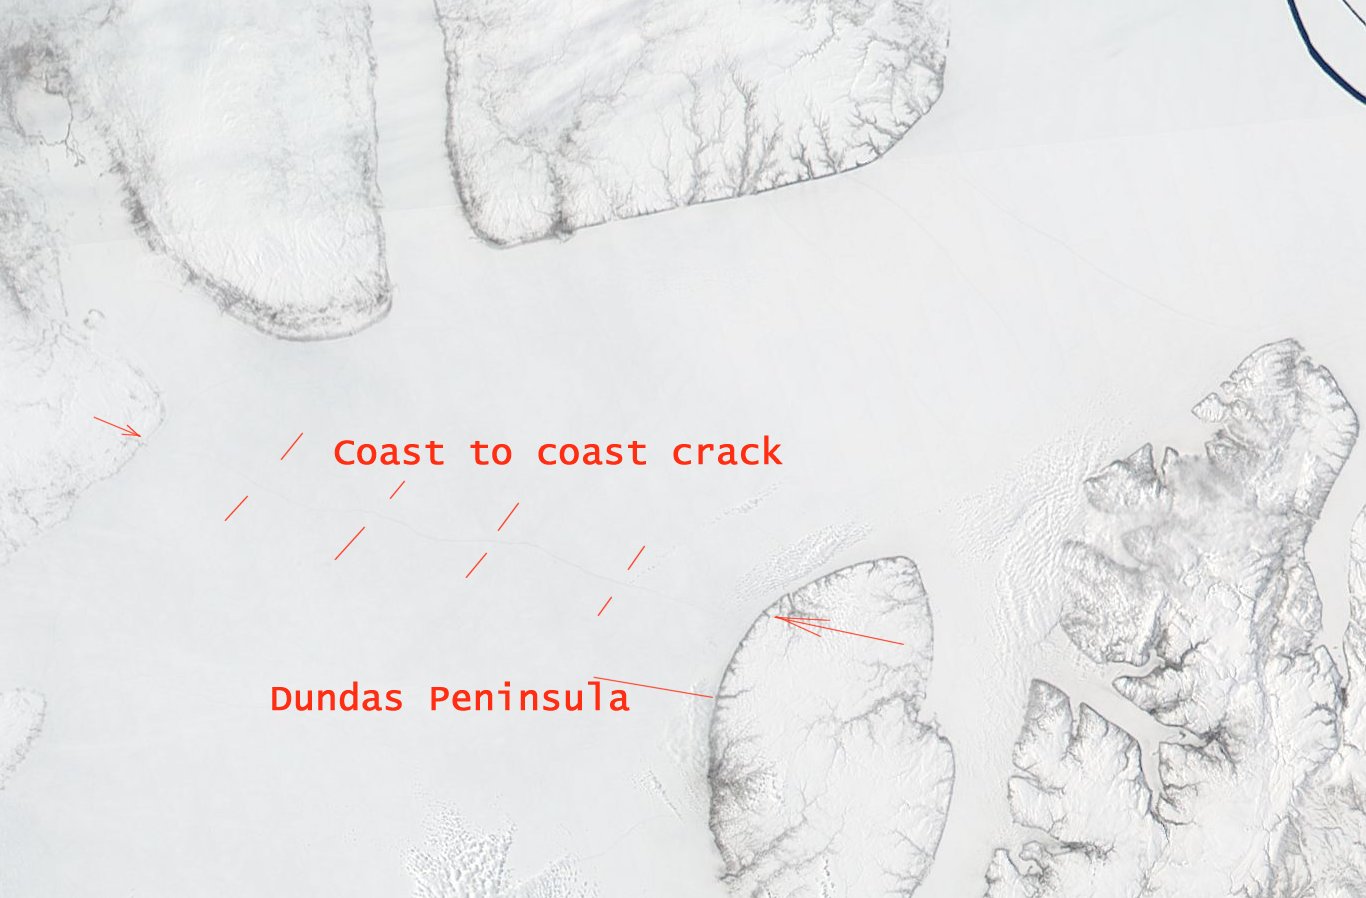
Region 6 - Dundas Peninsula
Where pressure ridges might be expected we see a narrow - circa 250m - crack. As tidal currents run under the ice they subject the ice to both flexing strains and bottom warming. This "tidal injection" bottom-warming mechanism is often overlooked. This weak point in the CA ice cover will most likely form a seed point for ice breakup, hastening the July melt.
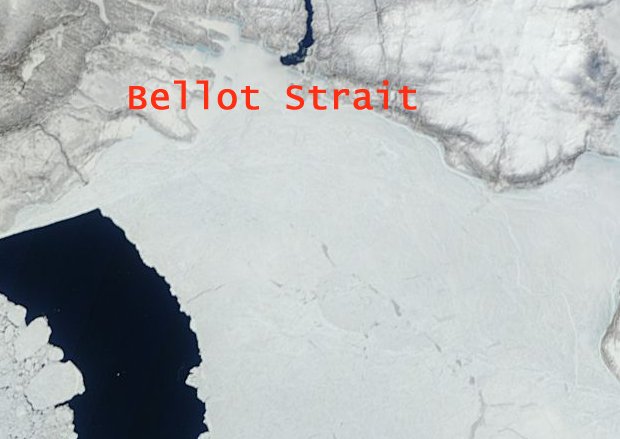
Region 7 - Gulf of Boothia
The rate of breakup here is about normal for the season. The Bellot Strait contains a persistent polyna. (See link below next image.)
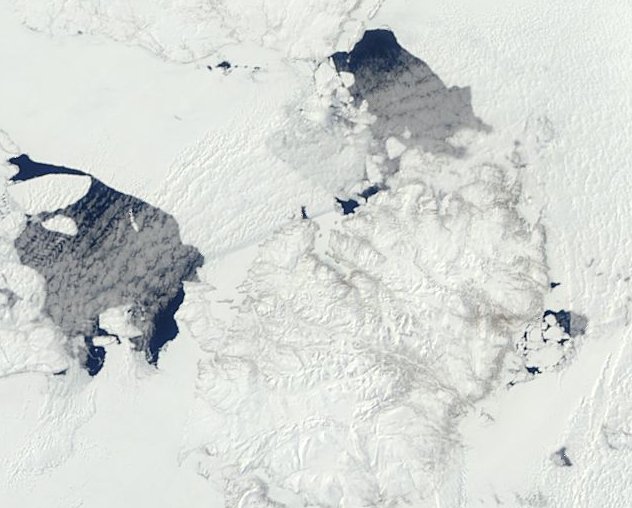
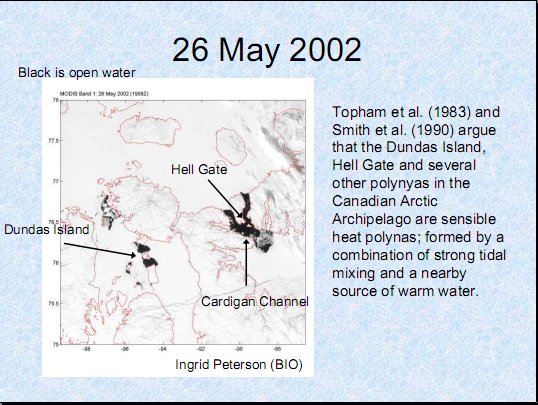
Region 8 - Grinell Peninsula region
This area contains many persistent polynas. They are described in Polynas and Tidal currents, Hannah, which is the source of the image below.
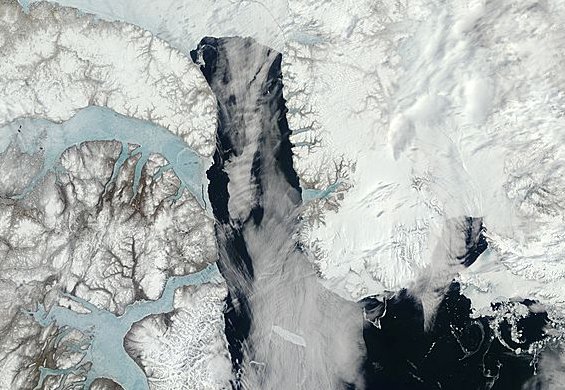
Region 9 - Lancaster Sound
Lancaster Sound is joined to Baffin Bay. Explorers in the days of sail would attempt to enter this sound after a dash around the Baffin ice in late Summer.
A page of resources concerning CA ice flow.
E - Baffin Bay
Baffin Bay was first entered by John Davis in 1585. William Baffin, after whom the bay is named, explored it in 1616. It was about 200 years before any other explorer could enter Baffin Bay. These days there is little sea ice left there by the end of July.
Baffin Bay June 2013
In the North of Baffin Bay is Nares Strait, which links to the Lincoln Sea. Melt is proceeding there at what is now considered to be a normal pace. In the past such a pace of melt might have been considered normal for July.
Nares Strait
Petermann fjord is located in Nares Strait. The Petermann glacier is in retreat. Since the massive 2010 and 2012 calvings the rate of calving appears to have slowed somewhat. The ice tongue is being pushed into a narrowing fjord. I predict that once the glacier has retreated to a point where the fjord is more nearly parallel the rate of calving will increase from this year's levels. The image below shows the calving front as it was on August 26 2012.
Petermann glacier August 26 2012
In the same region E marked on the top image lies the last remnant of the Ward Hunt ice shelf. It is shown in this image from August 26 2012.
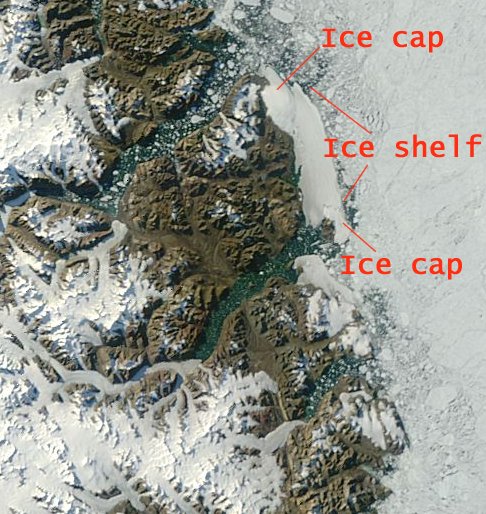
Ward Hunt ice shelf August 26 2012.
The ice shelf remnant has probably persisted because it is anchored at each end to an ice cap. That remnant of the The Oldest Arctic Ice cannot persist long in a warming Arctic, even though that coastal region is still one of the coldest places in the Canadian Archipelago. Even though anchored to ice caps there is nothing to prevent the ice shelf breaking in the middle, after which the ice islands will move out.
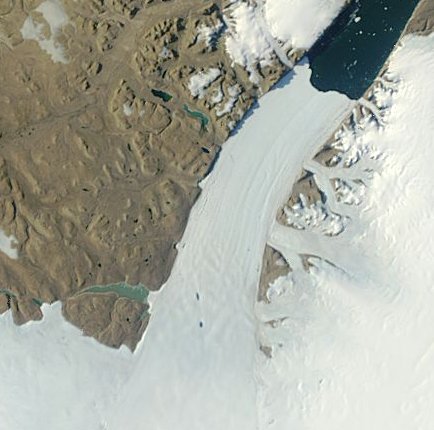
F - Disko and Jakobshavn
Disko, or Qeqertarsuaq, is a large island in Baffin Bay. In most years since the region was first explored by Europeans - probably including the Vikings - the sea ice has melted out, making Disko an ideal base for expeditions further North.
Signs that the region may be warming include earlier melt of sea ice and early formation of melt pools on the edges of the Greenland ice sheet.

Disko, Jakobshavn and melt pools
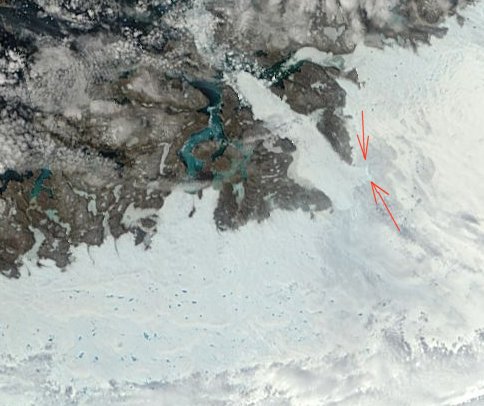
Jakobshavn glacier
Jakobshavn glacier has retreated substantially since about 1850 and is still retreating. In the image above the arrows point to a white area which indicates calving restrained by sea ice.
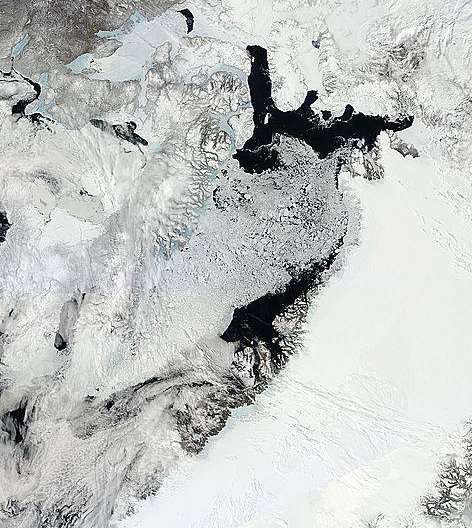
G - Scoresby Sund
Scoresby Sund is named for William Scoresby, who first explored and mapped the area in 1822. Prior to his explorations the area had been unreachable due to the persistent Greenland ice barrier. For a long time after Scoresby, areas North of the region could only be mapped by sledging parties. The North East coast of Greenland is now one of the fastest warming areas in the Northern hemisphere.
Our tendency is to lump the Greenland Ice Sheet into one category impacted similarly by each of the dynamic forces that impact flow. This is akin to saying banks, credit unions and savings and loan institutions are impacted similarly by all the economic forces. In the case of a recession there is a shared signal, just as with global warming there is a shared signal among Greenland glaciers. This is a simplification that does not work.
Greenland Ice Sheet Index
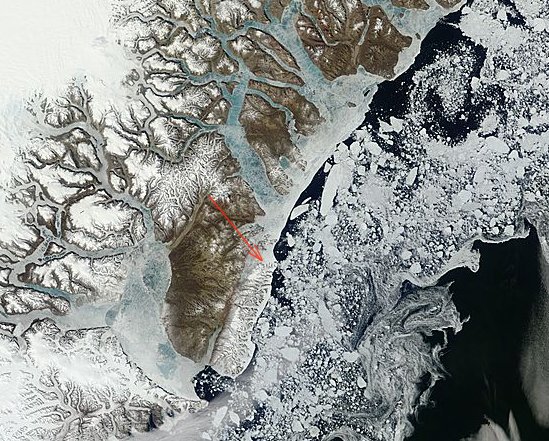
Scoresby Sund
The arrow points to Warming Island. The blue melt pools and the extensive swirls of ice smoke show that the ice here is melting out.
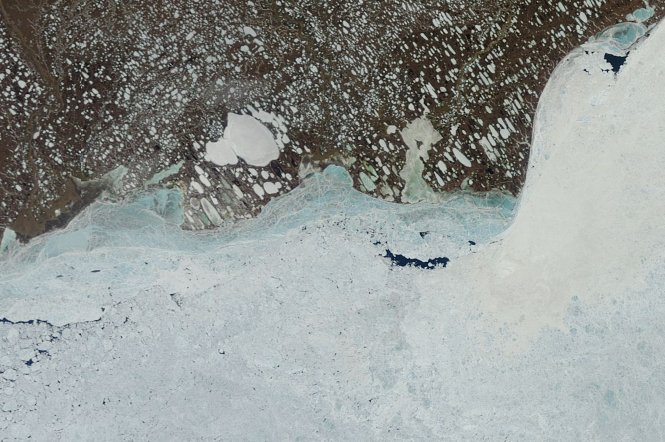
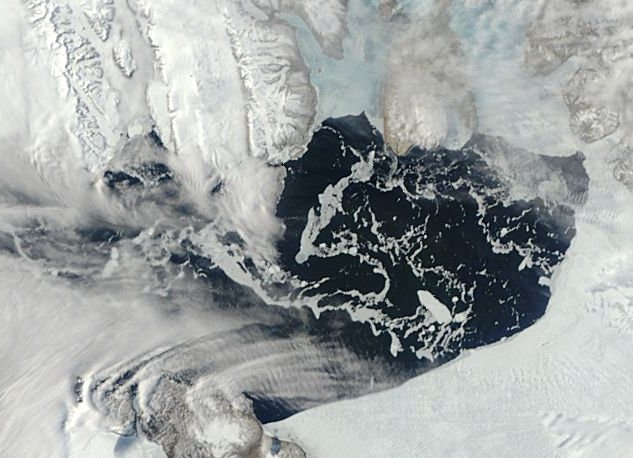
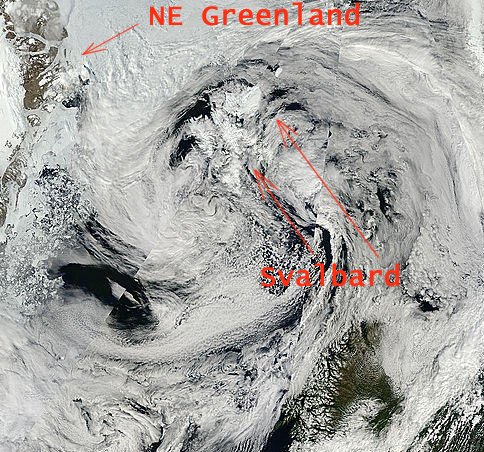
H - North East Greenland
The land-fast sea ice along Greenland's NE coast is subject to cycles of melt and re-formation. Over the past few years this cycle, which used to last many years, seems likely to have switched to an annual cycle of mainly first-year ice. I covered this in a recent article - Glacier Changes In NE Greenland.
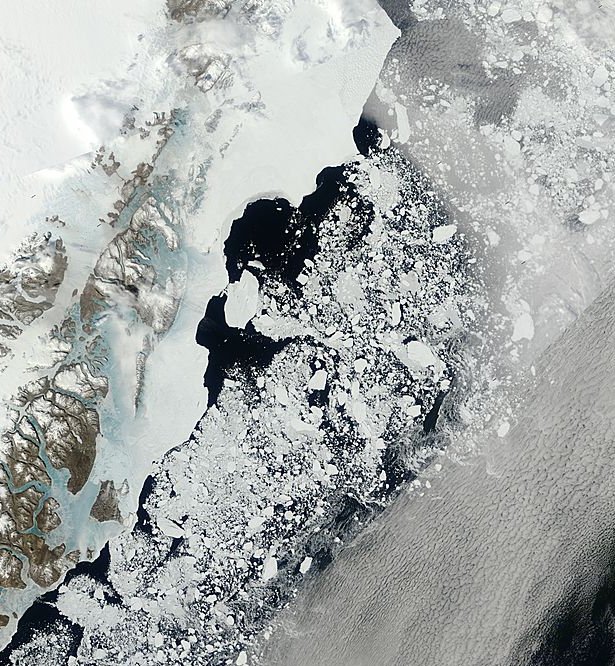
North East Greenland
The shorefast ice is breaking up and there are extensive melt pools.
I - Greenland Sea and Svalbard
Svalbard has the distinction of being home to the world's most Northern railway, albeit derelict.
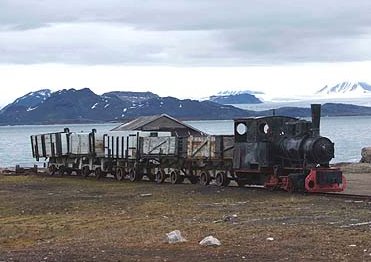
Locomotive on Spitzbergen
See link above for full image.
In the past it was most unusual for Svalbard to be entirely surrounded by open water in late Summer, but this has now become the norm in early to mid-Summer. Last year there was substantial open water North of Svalbard by July 07. This year the same open water extent will likely be reached earlier.
Svalbard July 07 2012
Research shows that the glaciers in Svalbard are melting and getting smaller. This is taking place because the climate has become generally warmer in the past 100 years. Higher air temperatures have brought a more rapid retreat in the last 10 years.
A glacier gets smaller because it loses more mass during the summer than it adds in the winter. It is mainly temperature and precipitation that control this relationship. Measurements of the mass balance in three glaciers in Svalbard show that two of them, which are in the lowlands, had a negative mass balance from 1967 to today, whereas the third, which is situated higher up, had a positive mass balance until 2000, but it, too, has had a negative trend since then.
Glaciers are getting smaller and are retreating
J - Barents Sea and Franz Josef Land
A recent study by the Institute of Marine Research, the University of Bergen and the Bjerknes Centre for Climate Research in Norway shows that the northwest Barents Sea warmed substantially during the last decades. The temperature of the subsurface Atlantic Water in the northern Barents Sea increased rapidly during the late 1990s.
Science News, September 05 2010
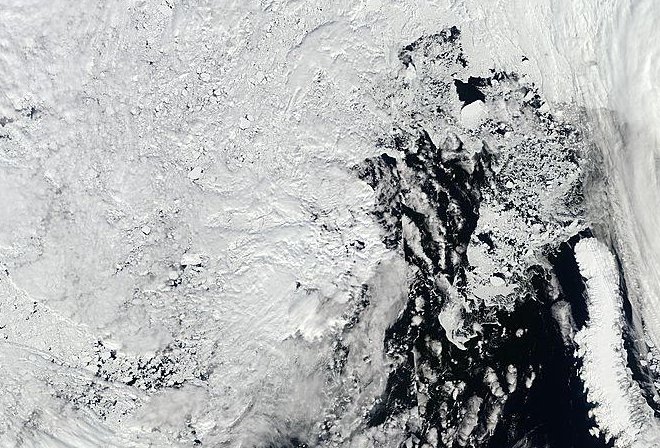
Barents Sea June 2013
Cape Fligely is the Northernmost point of Franz Josef Land. Julius Payer, a lieutenant in the Austrian army on the ship "Tegetthof", discovered Cape Fligely in 1874. He was a member of the Austro-Hungarian North Pole Expedition of 1872–74. Their ship, the Tegetthoff became ice-bound in 1872. She was abandoned in 1874 and the crew returned home over the ice.
In June 1899 H.R.H. the duke of Abruzzi started from Christiania in his yacht, the "Stella Polare," to make the first attempt to force a ship into the newly discovered ocean north of Franz Josef Land. The "Stella Polare" succeeded in making her way through the British Channel to Crown Prince Rudolf Land, and wintered in Teplitz Bay, in 81° 33' N. lat. The ship was nearly wrecked in the autumn, and the party had to spend most of the winter on shore, the duke of Abruzzi suffering severely from frost-bite. In March 1900 a sledge party of thirteen, under Captain Cagni, started northwards. They found no trace of Petermann Land, but with great difficulty crossed the ice to 86° 33' N. lat., 20 m. beyond Nansen's farthest, and 240 m. from the Pole. The party, with the exception of three, returned to the ship after an absence of 104 days, and the "Stella Polare" returned to Tromso in September 1900.
Encyclopedia Britannica 1911
Since those times the ice has become ever less of a hazard to navigation. There has often been open water around the islands which have now been well explored. The region is clearly warming.
"We have explored 42 of the archipelago's 191 islands and concluded a reduction of the ice sheet from the last Soviet expeditions in 1957," said head of the expedition Maria Gavrilo, an ornithologist.
Space Daily, November 21 2012
K - Kara Sea and Laptev Sea
The Kara Sea was formerly a major obstacle to navigation. It was not until 1878 that a ship was able to pass from the Atlantic to the Pacific via the Kara Sea. Finnish explorer Adolf Erik Nordenskiöld achieved this feat of navigation and exploration by over-wintering in the Chukchi Sea.
Because of the perennial thick ice it was necessary to build icebreakers so that freight could be shipped through the Baltic and Kara seas beyond the brief Summer season.
The Ermack was designed especially for ice-breaking in the Baltic and Kara seas, for the purpose of keeping open the northern ports of Russia either during the whole winter or for a longer period than they would otherwise be navigable, ...
Vice-Admiral Makaroff
The Icebreaker Yermak
L - Laptev Sea and East Siberian Sea
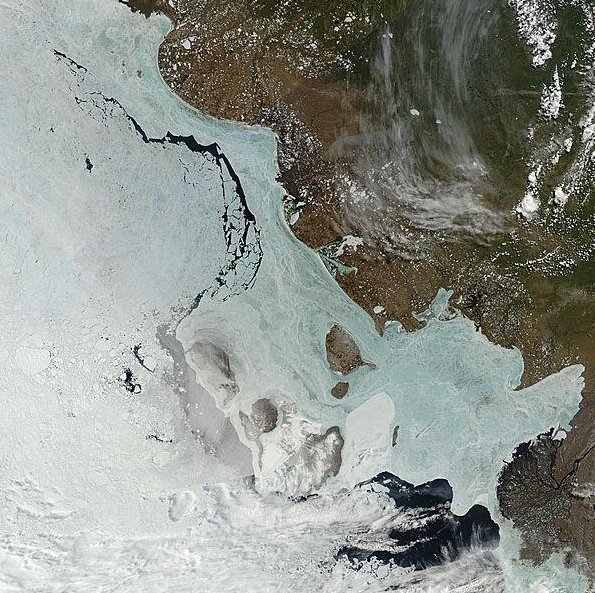
Laptev Sea and East Siberia Sea June 16 2013
Britain's Daily Mail, which has all too often published opinion pieces denying that global warming is a problem, seems to be more inclined to report actual science these days.
The Laptev Sea had an excess of carbon dioxide during the late summer of 2008 that was of the same order of magnitude as the western East Siberian Sea, probably caused by the breakdown of organic matter from the land.
The results [of the study] suggest that the Laptev Sea has changed from being a sink for atmospheric carbon dioxide to become a source of carbon dioxide during the late summer.
Miss Wåhlström's work is the latest to suggest that changes in the Arctic climate have the potential to play havoc with the Earth's delicate ecosystem.
Global warming is changing Arctic seas from where CO2 is absorbed to where it is produced, new study warns
Daily Mail June 19 2012
This concludes our 2013 tour of the Arctic.
Some points to ponder
The thermal mass of land and sea ice is the crucial core of the Arctic's thermodynamic cooling mechanism.
The Arctic ice pack is governed by two processes: thermodynamics and dynamics. The mass balance of sea ice is a straightforward thermodynamic concept. It is simply the balance of how much the ice grows in the winter and melts in the summer.
Mass Balance: What is it ?
A basic element in studies focused on thermodynamics is the mass balance of the ice cover. The ice mass balance is the great thermodynamic integrator. If there is net warming over time, then there will be thinning of the ice.
Mass Balance
There is growing recognition that reductions in Arctic sea ice levels will influence patterns of atmospheric circulation both within and beyond the Arctic. New research in the International Journal of Climatology explores the impact of 2007 ice conditions, the second lowest Arctic sea ice extent in the satellite era, on atmospheric circulation and surface temperatures.
...
"This suggests the sea ice conditions in the months preceding and during the summer of 2007 were not responsible for contributing to a circulation pattern which favored the large observed sea ice loss in that year. The circulation during autumn and winter which was more similar between the model simulations and the observed circulation suggests that the reduced sea ice in 2007 was in part responsible for the observed atmospheric circulation during autumn and winter of that year."
Study explores atmospheric impact of declining Arctic sea ice, May 28, 2013
Although the Arctic regions are now well mapped and explored, science still has much to learn. We can look forward to new discoveries in this new Arctic.
.


Comments