

The oldest non-glacial ice in the northern hemisphere is a small remnant of the former Ellesmere Ice Shelf which began forming about 5500 years ago. That remnant is breaking up. Where the ice shelf has vanished the fjords are free of perennial ice for the first time in 3000 to 5500 years. It seems likely that very soon the oldest non-glacial ice will be a mere 5 years old, or less.
Up until the 1950s much of the Arctic sea ice remained trapped in the Beaufort Gyre for periods measured in decades. The age of the oldest circulating sea ice was upwards of about 10 years. The oldest and thickest - greater than 10m - Arctic sea-ice was found trapped in the bays and inlets and along the shores of the northern coast of Ellesmere Island.
Since the late 19th century the Ellesmere Ice Shelf has shrunk to a small remnant by calving massive ice islands. It was the discovery of these ice islands in 1946 which led to renewed scientific interest in the ice shelves. We have a very good record of the Ellesmere ice shelves since then. It is a record of continual and rapid decline.
An aside on climate science
"Midwifery should be taught in the same course with fencing and boxing, riding and rowing."
Herman Melville, Moby Dick, ch.78
Within the pages of Moby Dick can be found many accurate descriptions of whaling and its history. Melville even notes the earliest written reference to whaling, in King Alfred the Great's record of the testimony of Ohthere of Hålogaland. But what has this to do with the Arctic or with climate science?
In Moby Dick, Melville hinted at the utility of knowledge in breadth - and used his own breadth of knowledge to bring alive the seafaring characters and the whaling action. The understanding of climate science requires knowledge in breadth: it is not just one branch of science, but many, with an admixture of other academic pursuits1. Somewhat counter-intuitively, one may even learn much about matters related to climate science through a scientific study of works of fiction. Certainly, works of fiction set in real locations by contemporary authors are usually a very reliable source of historical descriptions of the geography and climate.
Just as fiction can be a source of facts, so an eyewitness report can be a source of error. It can sometimes happen that an observer reports a thing truly seen, but is not believed. The classic example of an observation which turned out to be valid, but was not believed at the time, was the report of William Baffin in 1616 of open water in the bay which now bears his name. On the other hand there are many instances of reports accepted at the time as valid which turned out to be false. Many of these false reports in the Arctic concern islands which do not exist.
An aside on phantom islands
Throughout the history of Arctic exploration there have been many cases where islands were named and claimed, only to vanish forever. How could any explorer have been so mistaken as to draw an island on a chart where no island exists? It is too easy to dismiss such phantom islands as observer bias projected onto ice masses: such off-hand dismissal doesn't address the problem of island descriptions which included rocks, flora and fauna.
We now know that vast ice islands carrying rocks, flora and fauna are a natural part of the Arctic's cycle of ice accumulation and dispersal. A mass of ice firmly attached to land can accumulate the rock debris which tumbles downslope. At the margin where shorefast ice ends, rock debris can form a layer on the edge of the ice similar to a beach of rock fragments. When the ice breaks away to form an ice island it can carry the beach-like feature with it. It is quite reasonable to suppose that an explorer, unaware of this feature of ice, might take a rocky shoreline as a sign of ice-covered land.
With the benefit of hindsight it is tempting to assume that at least some of these phantom islands were ice islands. From the perspective of an observer landed on such an island it is an immobile object in a sea of mobile ice. A navigator taking a series of observations might have discovered the true motion of an ice island. But a navigator would have no cause to make a long series of observations to establish motion over the sea bed if he thought he was on an island.
The discovery of the ice islands
Between the age of exploration and the age of satellites stands the age of the aviator. In the quest for the military advantage that comes from quality information, military powers looked to the Arctic as a key to weather forecasting. Accurate knowledge of current and impending weather in a theater of operations is vital to the military. During WW2, weather reports were classified state secrets. The story of D-Day tells us the importance of weather forecasting: the invasion was almost postponed indefinitely due to severely adverse weather. Eisenhower proceeded with the invasion only because he had absolute faith in the consensus opinion of the climate scientists who were advising him.
From the dawn of aviation through two world wars and the cold war, the US, USSR, Canada and other nations sought means of obtaining timely and accurate information about Arctic weather for military and commercial benefit. For this purpose, many weather stations were established throughout the Arctic and Subarctic lands. Other weather stations - drifting stations such as
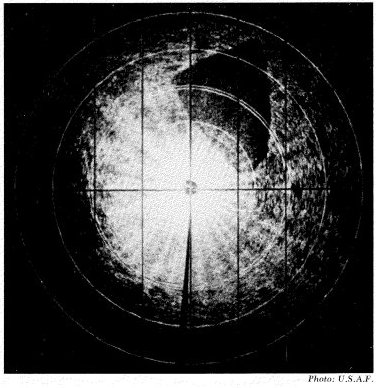
Radar target T1
Aircrew of the 46th Strategic Reconnaissance Squadron stationed at Ladd Field, Fairbanks, Alaska, spotted the first of these ice islands by radar. The ice mass, about 200 square miles in area, was designated Target X ,or Tl. Two other islands were found, then many more. The discovery was kept as a military secret until November 1950. The existence of the ice islands was first made public at the First Alaskan Science Conference, Washington, D,C, in November 1950.
The most widely reported ice island - T3 - was discovered by USAF Colonel Joseph Fletcher and later named Fletcher's Ice Island. It was monitored almost continuously from 1952 until it left the main pack via Fram Strait in 1983. Ice islands in the main pack survived for many years. Some of the ice islands were found in the many channels of the Canadian Archipelago, having drifted south.
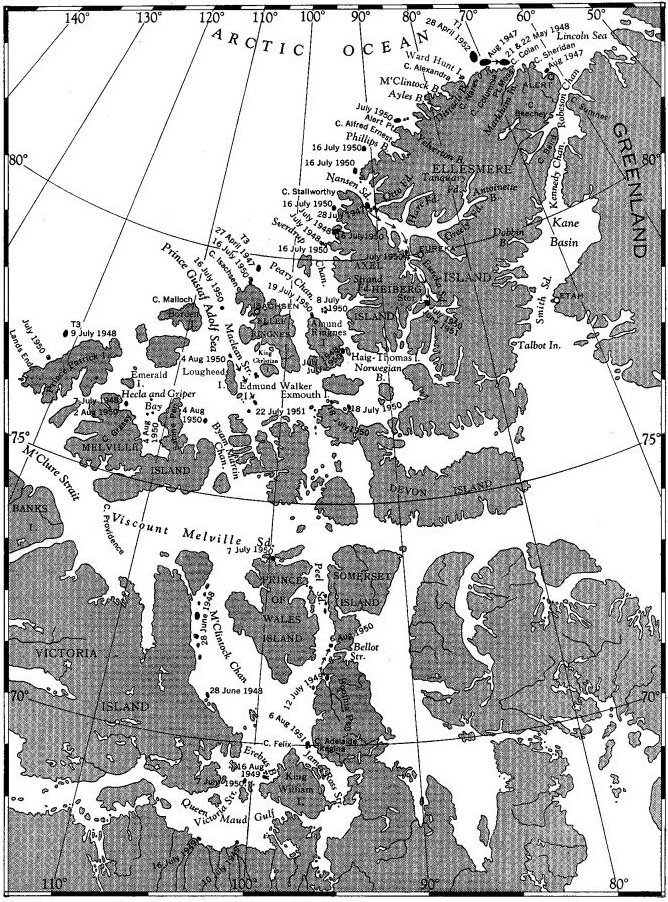
Map of ice islands discovered between 1946 and 1952
Apart from the great area and thickness of the ice islands, a striking feature was the patterned surface which showed a series of ridges and troughs. It was this pattern which initially led to the suggestion that the ice islands had calved from the ice shelves of ellesmere Island. Scientific surveys confirmed the origin of the islands by matching surface patterns, rock debris and ice layers. Many photographs exist in historical archives. With modern techniques we could manipulate these images to unify their scales and perspectives and put them together as a jigsaw puzzle by matching the surface patterns. This would give us a very accurate map of the extent of the ice shelves circa 1945 to 1946. It would also help to determine typical drift times of ice through the Canadian Archipelago.
Where the ice islands were tracked for long periods of time we have a very good record of drift patterns and durations in the main Arctic sea ice pack, as shown in the map below.
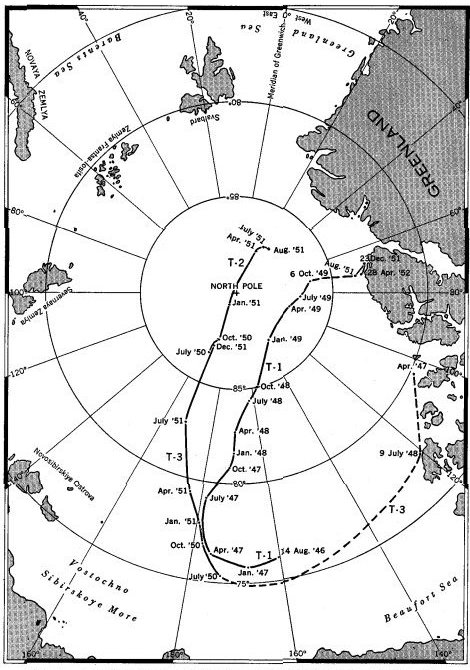
Drift tracks of ice islands 1, 2 and 3
Cross-disciplinary studies of ice islands
The existence of the patterns on the ice led to speculation about their probable mode of formation. The ensuing investigations afford a perfect illustration of how a complex natural phenomenon comes to be understood when viewed from a cross-disciplinary perspective. The formation and destruction of ice islands and ice shelves is best understood by combining findings from historical researches, geology, paleontology, meteorology, fluid dynamics, acoustics and many other disciplines. The initial research, by the way, was not funded so much as climate science, but more as a matter of potential military benefit.
Snow rolls and catenary ripples
The parallel undulating lines on the ice islands and shelves are described in the literature as snow rolls. Ripples which form in sediments in roughly parallel lines are known to geologists as catenary ripples. I suggest that this is a more appropriate term for the ice shelf feature, especially since the term snow rolls may be confused with snow rollers2. Catenary ripples are very common. They are found as 'fossil waves' in rock, as ripples in desert sands and perhaps most commonly as ripples in the shallow sediments of slow-moving waters.

Ripple marks in sandstone, Moenkopi formation
credit Daniel Mayer, Wikimedia Commons
One mode of ripple formation occurs when shallow, slow moving water flowing over an obstruction sets up a cyclic fluid motion which disturbs fine sediments. The sediments tend to be picked up where the current is faster and more turbulent, and deposited where the current is slower and less turbulent. This can form ripples across a stream bed. Another mode occurs at the edge of slowly rising or falling tidal waters.
Sediment disturbance at the air-water boundary edge
The water flow at the edge of a slowly moving rising tide causes a line of turbulence at right angles to the sediment ripples. During a falling tide the runoff tends to increase the depth between ridges. A typical catenary ripple pattern is shown below.
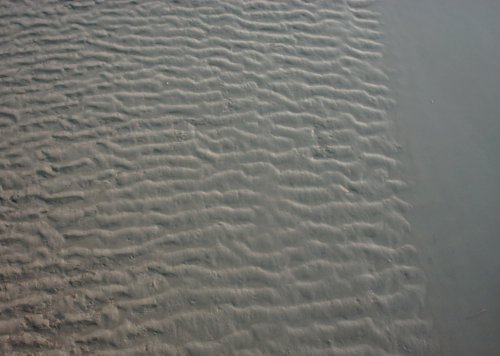
Catenary ripples in sediments, incoming tide, River Medway, Chatham, UK
In the photo above, the ripples gradually degrade where the flow has been faster, with a more turbulent motion. The similarity between the sediment ripples and the ice ripples is quite striking. The catenary ripples on the ice are on a much greater scale - typically 250m between crests and from 2 to 6 meters in amplitude - but this difference should be unsurprising given the differences in transport modes in an incompressible liquid and transport by the compressible air.
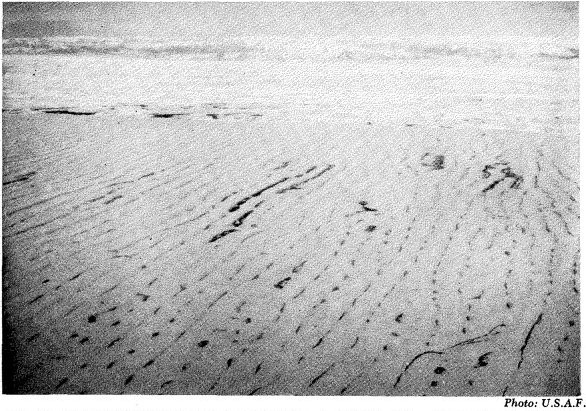
Target T1, low level photo, 1951
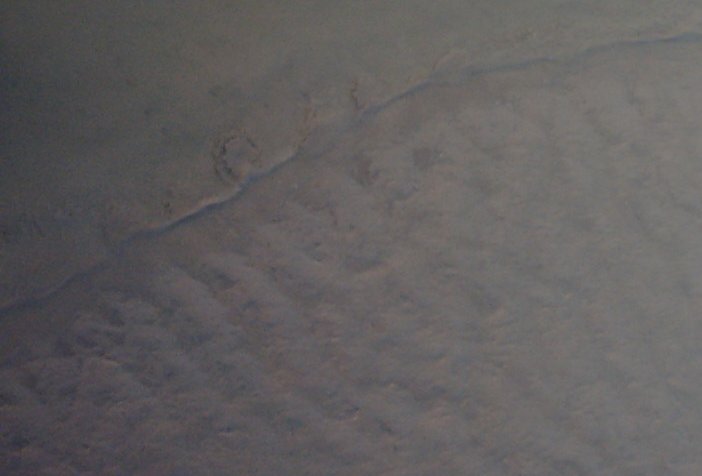
Most images of the ice islands show catenary ripples. Some, however, show a less uniform pattern reminiscent of a computer-generated fractal image, as in the image below.

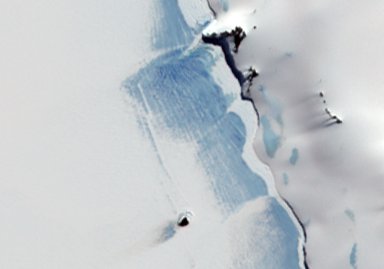
Pattern on an ice island
This pattern was most likely caused - I suggest - where the wind flowed with a high degree of regularity from alternate sides of a funnel-shaped bay.
The ripples on the Ellesmere ice are undoubtedly formed by the action of wind. To the best of my knowledge there has thus far been no general agreement as to the exact mechanism of formation. I suggest that the undulations begin as lines of snow deposited on relatively flat ice when wind-blown snow flows over a ridge onto the ice. The air flow oscillates as a lee wave, dropping the snow in regular lines. The mechanism is clearly illustrated in the next image.
Snow ripples on sea ice near Erebus Ice Tongue, Antarctica
image source: http://earthobservatory.nasa.gov/
If the lines of snow freeze, rather than melting, then further air flows within a fairly narrow range of velocities will tend to be reinforced at the resonant frequency of the undulations. This, I suggest, is somewhat like the resonance effect in acoustics. As each subsequent standing wave deposits snow on the crests of the waves the height of the feature increases. In the case of air just above the melting point of ice, the flow over the crests will be cooler and the flow over the troughs warmer. The smallest change in temperature due to flow profile in a wind at about 0oC would seem to be enough to confine melting to a narrow band in the troughs.
A warmer wind would melt the ice without distinction. The sun also would melt the ice without distinction as to crest or trough. However, for most of the Arctic summer the low sun would cast shadows so that any melt from direct insolation would presumably be confined to south-facing flanks.
Over a sufficiently long period of time the mass of the crests deforms the ice due to the disturbance of hydrostatic equilibrium. The upper profile comes to be matched by a deeper underwater profile. In effect, the ice consists of thick slivers held together by much thinner lines of ice.
Causes of shelf loss
I have suggested that air at close to 0oC can cause melting in the troughs while leaving the crests and flanks unmelted. This mechanism would also explain the breakup of the ice shelves in a warming climate. If air temperatures become progressively higher then the melt profile in the troughs of the ripples will become progressively wider and warmer. Eventually, the meltwater will etch away enough ice to allow one or more rafts or slivers to calve.
Ice shelf calving is not possible if the ice pack is pressing strongly against the ice shelf. The dominant ice circulation patterns in the Arctic promote such pressures. If the circulation pattern allows the pressure to be relieved, or if the sea ice is too thin to prevent ice shelf calving - or both - then shelf ice loss becomes more likely.
In the Arctic we have seen rising temperatures, loss of multi-year ice and changes in ice circulation. It is small wonder that the former Ellesmere Ice Shelf has been reduced to a small remnant. Approximately 8900 km2 of ice shelf in 1900 has been reduced to about 350 km2 as of 2011. The figure of 350 km2 is my estimate based on a study of MODIS images showing breakup in progress on the Ward Hunt Ice Shelf in August and September 2010. That calving event went widely unremarked in the media due to focus on the much greater calving of the Peterman Ice Island.
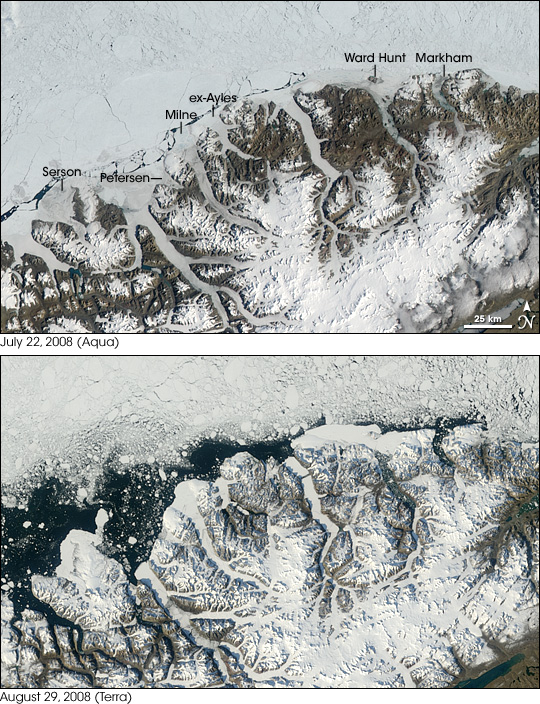
images source: http://earthobservatory.nasa.gov/Features/Ellesmere/
Footnote
[1] - Given that climate science is so all-embracing it is mind-bogglingly ludicrous to suggest that there is some sort of conspiracy among climate scientists to fabricate evidence of global warming. Such a conspiracy must include every person who ever wrote a description of local or regional weather. That would be most of the literate community of every age. Even the greatest preponderance of scientific evidence can be dismissed out of hand, and jangled nerves soothed, if only one may apply the soothing balm of invincible ignorance. Carl Marx was wrong. It is not religion that is the opiate of the masses: it is conspiracy theory.
[2] - Snow rollers are illustrated in my article Reading The Cryosphere.
Sources and references
The b/w images are taken from some of the earliest issues of the journal Arctic covering the ice island discovery and studies. The url below is a link to the index. The articles are free to download as pdf files.
http://arctic.synergiesprairies.ca/arctic/index.php/...
Ward Hunt Ice Shelf Breakup August 2010:
http://earthobservatory.nasa.gov/IOTD/view.php?id=45463
History of US drifting ice stations:
http://www.whoi.edu/beaufortgyre/history/history_usdrift.html
http://www.airpower.maxwell.af.mil/airchronicles/aureview/1966/...


Comments