


It isn't, air quality in America is actually better than any time in the last 100 years, but a suspect data set embraced by the Obama administration led to his EPA pivoting from concern about real pollution - like smog, PM10 - all the way down to PM2.5, which is particulate matter so small you can't see it. Unless you have an electron microscope in your house. The only reason people think they see it is when they see actual smog or smoke or haze and then a map shows it orange or red. That is easy to do on a relative color scale, and 2.5 is obviously 25 percent of 10 so there is 400 percent "more" of it.(1)
Because EPA embraced this strange 'defining air deviancy down' approach, America's most populous state, California, did the same. It was then that things got weird. Using 'virtual' pollution led to claims like that grilling a hamburger was worse for the environment than driving an 18-wheeler. That wasn't the worst of it. Armed with a new thing to scare people about, epidemiologists and the activists who support them began to look through lots of data sets and create statistical significance wherever they could. They correlated virtual pollution to lower test scores for kids, to lives saved and lost. They correlated virtual pollution to non-alcoholic fatty liver disease - basically, obesity. And to getting Alzheimer's. You name it and it is linked to particulate matter our forefathers breathed in for thousands of years without even knowing it existed.
They even claimed such virtual pollution was changing the taste of coffee.
Epidemiology papers are strictly exploratory, of course, they should not be used to make policy because while they are potential roadmaps to science, they are not science itself. That has not not stopped lobbyists from promoting correlation as real causation, no differently than activists embrace every IARC correlational claim about a chemical if it will give them something new to sue over.(2)
A new paper gives us even more reason than the impossibility of more LA 'bad air' days during the pandemic to start thinking about real risk and not about the virtual kind. The problem is that all government-funded scholars are still conflating wildfire smoke, PM10 and ozone, with PM2.5 and declaring them all equally hazardous. If you want to do a paper showing that there is no risk by PM2.5 by itself, it is only if you conflate it with PM10, you cannot and will not get funded. Yet there cannot be PM2.5 in a fire so why use them interchangeably?
An objective look at the dats shows that wildfires cause more real harm and risk in one day than virtual pollution ever has, can, or will.
Beijing is one of the most polluted cities in the world but all they do is not PM2.5 and they can declare their air is clean. Who's believing they have cleaner air than San Francisco? Only people in San Francisco, the California Air Resources Board, and government-funded academics who are unemployed if they don't say it.
Now we are stuck with air quality maps that are so lacking an evidence foundation that Los Angeles in 2020 had more bad air days since records were kept. During a pandemic, when no one except delivery people were driving, the air quality supposedly went down. It didn't. California laws have defined air quality down to where its topology dictates it can never be clean.
In the real world, wildfires bring dangerous levels of smoke, and cause for more pollution risk than automobiles or virtual pollution like PM2.5, regardless of how many activist epidemiologists claim each month we're all dying without more regulations.
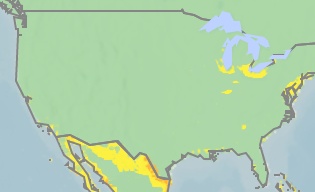
In the real world, American air looks like this.
And in 2022, that science reality needs to get ahead of the air quality equivalent of COVID-19 'if any person might be harmed vaccines should be banne' deniers are selling.
NOTES:
(1) Imagine if I take a survey and ask people to grade "Spider-Man: No Way Home" on a scale of 9 to 10. If it is even average, a studio can claim my study found that it was a 9.5 out of 10 on Science 2.0. That is what is happening when maps with PM2.5 are thrown around and conflated with actual pollution.
(2) Then the Obama EPA began to include epidemiologists on its panels. Including epidemiologists they funded to study the exact thing they were on the panel to look at objectively. That is like FDA hiring Pfizer scientists to approve Pfizer drugs but it became common in air pollution panels a decade ago. Conflicts of interest are ignored by progressives when it is their side doing it.
When President Trump tried to institute a policy to avoid conflicts of interest that way, activists flipped their usual script on its head - 'we want the best experts on these panels and that means those who get funded', the opposite of what they charge when it comes to every product they want banned.


Comments