

The only thing I think I can discuss with you here now is the predictions on the Higgs boson significance level produced by CMS in October 2010 - a couple of geological eras ago, that is. Those predictions can be trusted because 2011 data showed to be perfectly in line with them, both for the 95% CL limits and for the significance -of course the former are valid in the full mass range and provide more verification power than the single significance number, which is only valid if the Higgs boson exists and has a particular mass.
So the 2010 predictions were produced with 10 inverse femtobarns in mind and 7 TeV running. Now let me remind you that 10/fb is exactly what CMS has available to analyze for Summer 2012 conferences, and that in 2012 we have actually ran at 8 TeV, where the Higgs production rate is higher and signal to noise ratios are slightly better. So a sensitivity plot made with 10/fb at 7 TeV is a slightly pessimistic view. Still, let us see what is the prediction for a 125 GeV Higgs boson, below.
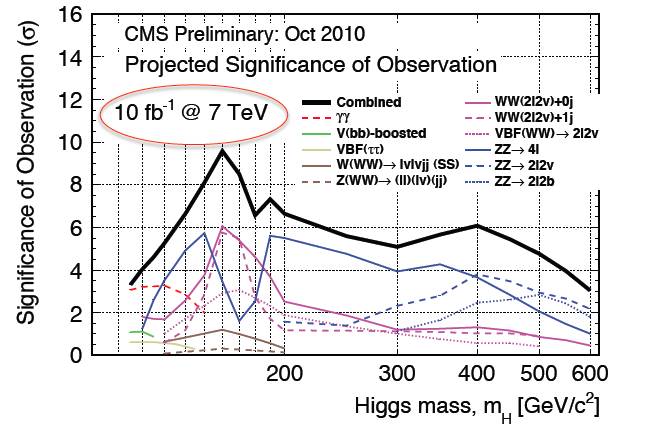
You should be looking at the black curve, at the point where the horizontal axis corresponds to 125 GeV: that is between the second and third vertical line after the 100 GeV one (this is a logarithmic x-axis plot, so it is not completely straightforward to read it). If you look carefully, you will get the following predictions:
- a >3-sigma excess in the gamma-gamma mode
- a 2.5 sigma excess in the ZZ -> 4 leptons mode
- smaller excesses in the WW decay mode and other channels
- a combined significance just short of 5 sigma.
Now, the above are median values of wide distributions. To explain what that means, imagine the histogram of heights of sixth graders in a school. The distribution will be wide, with a peak at about five feet. That is the mode of the distribution. The median, instead, is the value above which there are half of the kids (and below which there's the other half). In the plot above, each curve was computed by looking, for each mass hypothesis m, at a distribution of possible experimental outcomes (given the presence of a Higgs boson at that mass value); the median is computed, and plot, for each mass and for each curve. So while the black curve could be telling you "CMS will have a 4.7 sigma significance with 10/fb at 7 TeV", what you should read is "the median significance will be 4.7 sigma". You will not be able to know, from the figure, how wide is the distribution -not any more than you will be able to tell how many kids are 5'6" or taller in the sixth graders example. The distributions of possible significances is wide, and if the experiment is unlucky the significance may be much lower than the median; or if it is lucky, it may well exceed five sigma.
I hope this helps you putting in the right context the information that is circulating in the web these days, together with the predictions above.


Comments