

The claim is based on the signal they find, 17.8 fitted events making a peak in the reconstructed mass distribution, a signal whose significance is computed to exceed five standard deviations: 5.4 of them, to be precise.
"Five sigma", as it is dubbed by particle physicists, constitutes a psychological threshold above which they lose all their inhibitions and lie their claims on the table.
Since that particle is at reach of another particle physics experiment, and it is thus reasonable to expect that new results on it will be published soon, I will entertain myself in this post in the rather technical discussion of whether the observed signal found by the DZERO collaboration does in fact correspond to a "observation-level" find. That is because, of course, I have my doubts -you wouldn't be surprised if you knew me.
Now, customarily, before venturing in a detailed explanation of where do my doubts arise on the significance published by DZERO, and providing my own estimate of that number, I would typically describe here, for those of you who are not professional particle physicists, what a baryon is, what is the physics of its production and decay, why it is important to discover all of them, and the details of the DZERO analysis. However, I will have to ask you, dear reader, for your forgiveness today. This post would become too long if I did that. Instead, since I know I will be discussing this fancy new baryon very soon again, I will defer those details to a future post.
The significance: Hic Sunt Leones
So let me directly come to the point of an evaluation of the statistical significance of the signal found by DZERO in their nice analysis. If one reads the paper, one is left with a doubt on the exact procedure by which that is evaluated:
To assess the significance of the excess, we first determine the likelihood L_(s+b) of the signal plus background fit above and then repeat the fit with only the background contribution to find a new likelihood L_b. The logarithmic likelihood ratio [ ln(L_(s+b)/L_b) ]^0.5 yields a statistical significance of 5.4σ, equivalent to a probability of 6.7 × 10^−8 that the background could fluctuate with a significance equal to or greater than what is observed.So, DZERO uses the "log-likelihood approach" to estimate the significance of the peak they find in the reconstructed mass distribution. It is a bit technical to explain the magic behind it, but in essence, two concurrent hypotheses are compared by a mathematical formula: the hypothesis that the data is only constituted by background processes, distributed with a flat distribution; and the hypothesis that the data contains a flat background and a Gaussian signal, whose width is known, but whose mass, crucially, is not.
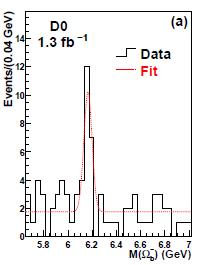 The Devil, so they say, is in the details. When I saw the graph showing the DZERO signal of Omega_b decays (see right) I tightened my eyelids, tilted my head, looked sideways at the histogram; in the meantime, the mathematical coprocessor installed in my brain was frenetically comparing the observed pattern to other signals I had seen coming -and some of them I had also seen going- in the past: 5.4 standard deviations are a really significant signal, and that nice bump, to me, did not look that outstanding. And being a son-of-a-bitch, I decided to check by myself the claim made in the paper.
Now, you must realize that this is already a bit like entering a bank with a gun: you have not shot anybody yet, but still you feel guilty already. Because you are not supposed to do such a thing: once a paper has withstood the scrutiny of a big collaboration, and then the review of some anonymous reviewers working for the publishing journal, it would be nice if you accepted its conclusions without objection. Taking the data and performing checks on it is, to say the least, impolite. Still, let me do it today: we might learn something.
The histogram in Figure 2 of the paper, shown above, has 34 bins, and the number of entries in each of them can be clearly read out: 3,1,4,3,0, .... It is easy to re-create an identical histogram, fit it with a flat function, obtain the likelihood returned by the fitter, and do the same for the other hypothesis. Below is my own fit to the DZERO signal, in the case of a fit to the signal plus background hypothesis: as you can see, it matches very well the one of the paper.
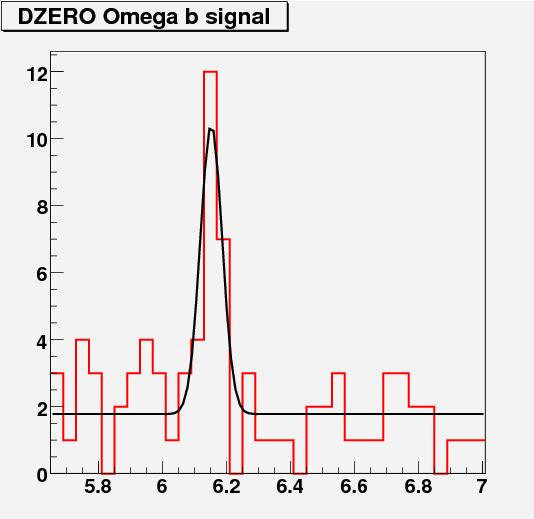
It is unavoidable that tiny differences may still exist: being unable to know the details of the DZERO computation, I have to accept the small approximation. If I now take DZERO's formula for the significance, I get the following numbers:
- P=8.17E-8 (DZERO finds P=8.7E-8);
- Significance = 5.41 standard deviations (DZERO quotes 5.4 standard deviations).
So things agree, roughly. But unfortunately, my calculation, and therefore also DZERO's, is erroneous. In fact, when one fits the data with the signal plus background hypothesis, one is adding TWO free parameters to it: not just the normalization of the Gaussian signal, but also its mass. DZERO is adamant on this point:
We fix the Gaussian width to 0.034 GeV, the width of the MC Omega_b signal.They would have told us if they had fixed the mass too, I presume. So they are throwing in two degrees of freedom, and the calculation of the significance must now account for that, because the factor -2log(deltaL) will now distribute like a chisquared with two, and not just one, degree of freedom. In other words, the more degrees of freedom you add to a function, the better you expect it to match your data points, and thus a much higher likelihood from the fit. If we take that into account, here is what we get:
- P=4.3E-7;
- Significance = 5.05 standard deviations.
Ok, so it is still a 5-sigma observation... Am I making too big of a deal about this detail ? Well, no. I think that the estimate of the significance of small signals is a very important point in the analysis of experimental data. My belief must be shared by many, since pages are spent discussing these issues in several statistics books; but most of all, the issue always deserves a discussion in the publications we see on new particles. So accuracy is expected on these matters. And to be sure, a 5.05 sigma fluctuation is five times more probable than a 5.4 sigma!
Since I believe that the above calculation will run into a few objections by my colleagues -and not all of them will be amicable-, for maximum transparency I have decided to make my code available to whomever wishes to call me a moron. In fact, I may well have made a mistake, and if so, I would like it to be clarified at once, before entering a endless debate. Science is so beautiful because there is truth somewhere, and it is actually accessible to us mortals! Getting down to numbers and formulas, and making plain the details of calculations when these are available, will always end all arguments.
So here is my ROOT macro for the DZERO Omega_b signal fit. If you download ROOT, you may be trying it by yourself in the matter of minutes. Have fun!
PS - Deep down in this post, I take the liberty to say that there is actually another point to make about the DZERO signal, and about the calculation of the significance. In fact, I believe that the significance of the signal is not even five standard deviations, as I have calculated above, but probably less. That is because the small number of event candidates is subjected to non-Gaussian fluctuations.
I will discuss a more methodologically correct way to compute the significance very soon, when I will compare the DZERO signal with a similar result will be published by another experiment...


Comments