

First of all, I need to explain that this effort is indeed very well in line with my ongoing line of research at the crossroads of artificial intelligence and fundamental physics (I do not write any more "particle physics", because I am involved in astroparticle physics experiments as well, and they offer some quite interesting use cases for optimization methods, too) - an area which is embedded in the aims of the MODE collaboration, which I founded 5 years ago.
However, there is a difference, as within a larger pool of scientists and computer scientists belonging to the EUCAIF coalition, where together with Pietro Vischia I lead work package 2 (WP2), I am trying now to concentrate on the topic of co-design - simultaneous optimization of hardware and software parameters. The final goal of WP2 would actually be the one of merging with WP1, which focuses on foundation models for fundamental physics. Indeed, a multi-modal model pre-trained on different datasets including particle interactions in media, atmospheric showers, geant4 simulations of various materials and setups, along with word-based information digested by a large language model, image recognition capabilities from training of energy deposits in calorimeters, etcetera etcetera, could be the foundation of any optimization study we might want to carry out for our experiments.
...But we are not there yet, not even close. So we need to take things one at a time. One of the ingredients on which to squeeze our brains at the moment is the interplay of hardware and software. I recently made an effort to cook up a simulation study of the simplest possible system that demonstrates the co-design idea. It is an example from muon scattering tomography.
A dumb but enlightening example from muon tomography
In muon scattering tomography you rely on a measurement of the deflection that cosmic-ray muon trajectories withstand when these particles traverse a unknown material, to guess the composition of the material and its density distribution. Imagine, for example, that you are a border control operator and you are searching for smuggling of Uranium inside concrete blocks carried by trucks from country A to country B. In absence of a notitia criminis on the fact that a particular shipment contains the material, you would have to rely on random checks (very ineffective) that destroy the concrete block. Or you could test for radioactivity, but this is also ineffective as the uranium could be shielded within some lead structure inside the concrete.
The solution is to put the volume within tracking detectors, and record the deflection of muons. From the distribution of deflections, which should conform to that expected for a uniform block of concrete, you may construct a test statistic. And the best test statistic you can ever conceive, in this scenario, is a likelihood ratio of two hypotheses: no uranium (null hypothesis, H0) versus uranium (alternate hypothesis, H1). This is the most powerful statistic to rely upon, to decide whether the volume is suspicious or not. [to well define H1 you need to specify the amount of uranium, but that is a detail which can be solved and we will leave it off this discussion.]
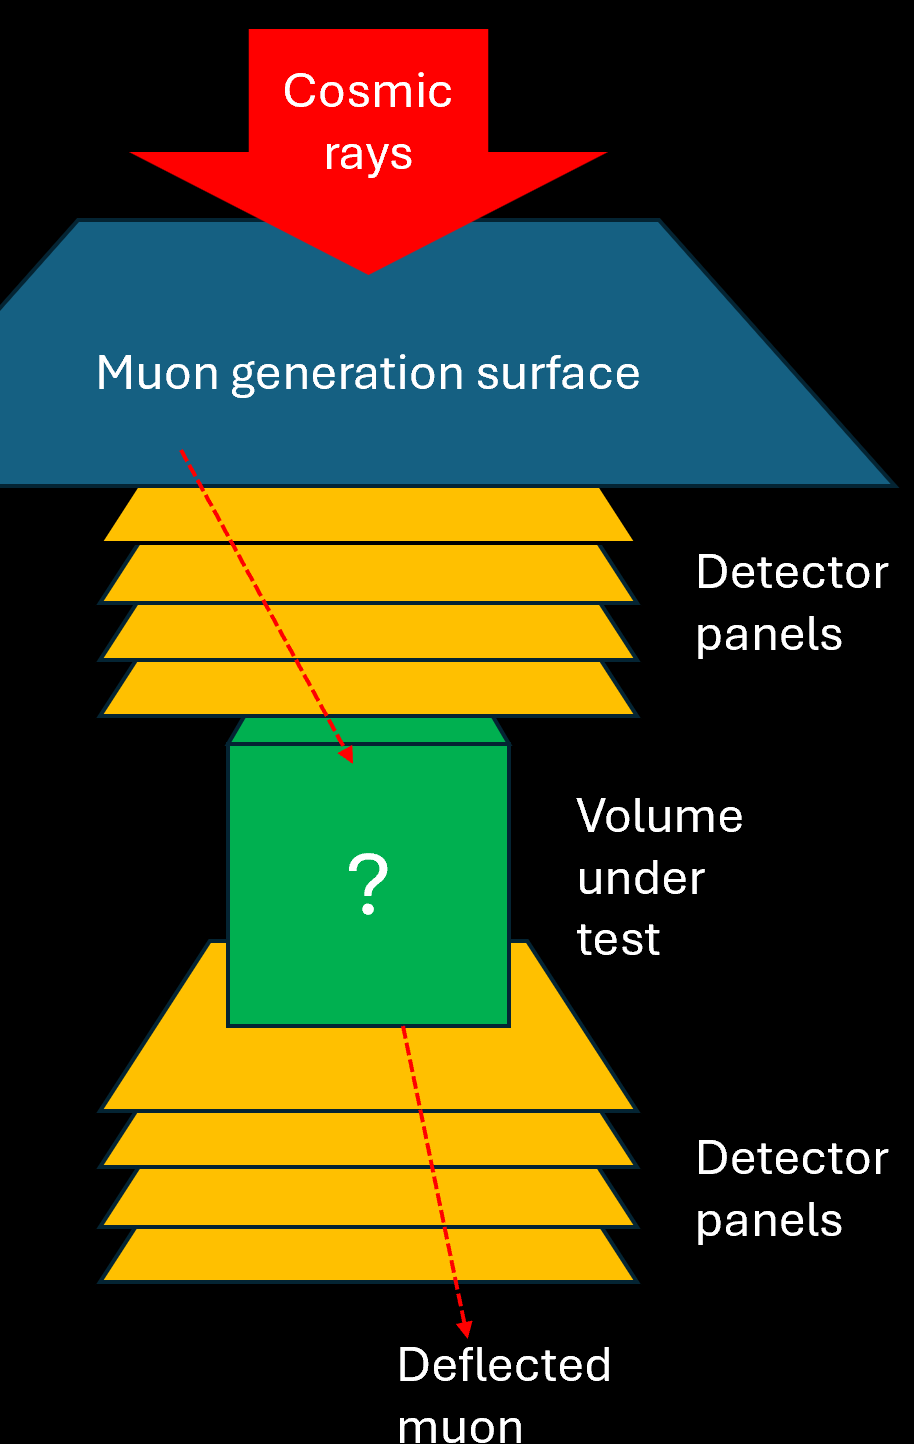
[Above: scheme of a muon scattering tomography I simulated to study the U detection problem.]
By computing the likelihood ratio you can decide if the tested volume falls in the "suspicious region" (critical region, in kosher terms) where there have been several high-angle deflections (of course, caused by interactions of muons with the very heavy nucleus of U). You will also have specified a suitable "type-1 error rate", say 0.05, which is the fraction of times that you allow yourself to cause a false alarm: 5% of concrete-only volumes will then by definition fall within the critical region.
Now, the larger the power of your test statistic - which depends on how good your detector is, but also how long you have observed muons traversing the volume - the larger will be the fraction of U-containing volumes that will fall in the critical region. So that is the utility function of your system of U-smuggling detection. However, detectors cost money, so the utility will also be a function of how much the detector costs. In the simulation I created, the detectors have a variable resolution on the position of passage of the muon tracks, and of course higher resolution detectors cost more. So there is a trade-off there, as higher resolution guarantees better discrimination of H1 from H0.
The other parameter of this dumbed-down model is the integration time. The more muons we collect the higher the power of our test will be, but we cannot keep the innocent driver of a concrete-carrying truck sitting for hours, waiting for more muons to impinge on the volume. So there is a cost associated with the integration time - proportional to the number of muons that are observed.
Co-design in practice
Now, the two parameters I mentioned above - position resolution of the tracking layers of our border control scanner, and integration time - are inter-connected in the definition of the utility function. The higher resolution allows for good power with smaller integration time, and vice-versa, but the dependence of the power of the detection of H1 is not linear. What happens, then?
We might imagine that if we are designers of the system, we could assume that the users will want to integrate muon deflections for, e.g., 10 minutes to scan a single volume. Then we can optimize the detector by choosing a resolution that guarantees the best compromise of cost and power. This means moving vertically from point 0 to point 1 in the graph below, where integration time is on the horizontal axis and detector position resolution is on the vertical axis (the more up you go, the less precision you have and the less the detectors cost).
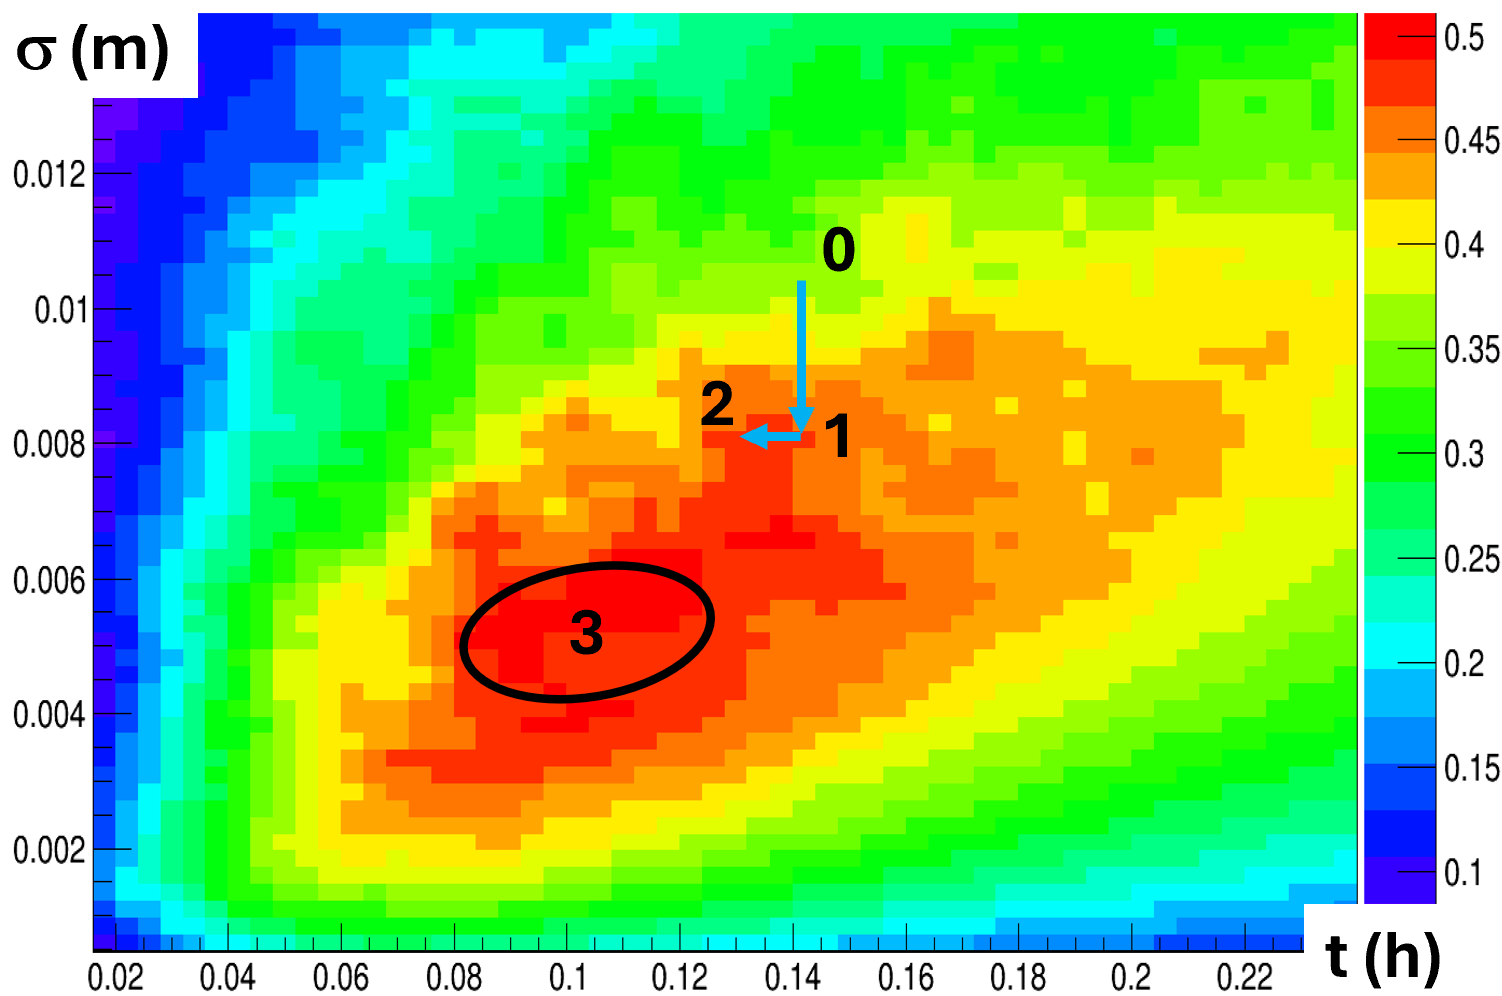
[Above, the color scale shows the utility values (bar on the right), as a function of software parameter t and hardware parameter sigma].
However, the designers know that by having identified an optimal hardware for integration time T0 the optimization is not over: given that hardware, we may now ask ourselves if we can tweak the integration time a bit, to gain a better global utility. By studying what happens as a function of a change of integration time at fixed optimized resolution we will then be moving from point 1 to point 2 in the graph. When we get there, we are happy: we maximized the utility for the problem. Or did we?
In fact, the graph has been created by examining ALL the possible combinations of integration times and detector resolutions. This is possible in this dumbed-down example, but in general is not possible because of the huge computing power required to scan the parameter space. But here we have the luxury of examining what has happened. And what has happened should give us pause, as the absolute maximum of the utility is not where we stopped: the point labeled "3" has a significantly larger utility than the point "2" where we ended.
This phenomenon - an interplay of hardware construction choices and software extaction of information from the resulting data - highlights how the co-design of these systems is the right way to go. What a co-design model would do is not to scan the full space as I did to create the graph: it is instead to navigate the surface of the utility function in a smooth way by gradient descent, rolling down (or should I say up) to the extremum of the utility. How can this be pulled off? By creating a model of the FULL system - the hardware, and the software - and by making it a differentiable model, such that we have access to the derivative of the utility with respect to all interesting parameters of the system. This is called "gradient descent" and it is the engine under the hood of most machine learning models today.
Moving on to more complex cases
The above example is clear - it shows that the serial optimization of hardware and then software of a system does not reach full optimality in case of strong coupling of the involved parameters, as we wanted. But it is a bit disingenuous. So for a scientific publication we should work out a more realistic example with more complexity built in. And things then get harder, of course.
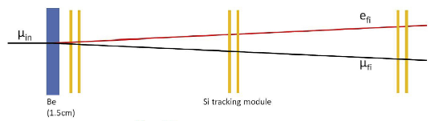
One idea I have is to consider a tracking system that is built to reconstruct the interaction of a charged particle with a target, producing a two-charged particle final state. This is common e.g. in muon-electron scattering, and indeed is the focus of an experiment (MuOnE) that wants to determine the probability of that reaction as a function of the energy exchanged between projectile and target. The goal of the experiment is to measure with as much precision as possible the angle of emergence of the two particles, as this measures the energy exchange (ok, the q-square of the process, if you know what that means).
In such a system there is a target - let us say a 1-cm thick layer of beryllium or carbon - followed by several tracking layers that record the passage of the particles. The structure (target - tracker) is repeated several times, so that we get to measure the incident particle trajectory and then the outgoing, forward-traveling final state particles too.
There are two elements of co-design in this setup that are interesting to study. The first one is the fact that the angle is best measured by performing a constrained fit that forces the three reconstructed trajectories to converge on a single point. This is a software reconstruction issue, but a trivial one at that. Now, if the hardware design considers only a 1-cm thick beryllium target, then the location of the vertex will for sure be within that 1cm, but we do not get more information on the vertex (and thus on the angle) by the hardware arrangement.
However, if we have been cunning enough to conceive a target made of a large number of extremely thin layers of, say, carbon fiber, spaced in air, making up the same total 1cm width of material, then we have a way to impose a further constraint on the vertex reconstruction, because the interaction has to happen within the carbon target, and it is much, much less likely to happen within the interspacing air. So the hardware and software of the system are coupled through this constraint, and their simultaneous optimization is likely to discover an impedence matching between spacing of the layers and resolution on the vertex along the incident particle direction.
More subtleties
And there is a second element of co-design in this 1->2 scattering example. The trajectories will be measured with precision by the system if the tracking layers are located with infinite precision along the direction of the beam. But this in practice is never possible: some uncertainty on their positioning will be expected. Maybe with laser holography you can reach a 10 micrometer accuracy in the positioning, but these things cost a lot of money. So is there another way?
Yes. If you use a fraction of the collected scatterings to fit not for the energy of the interaction but for the location of one tracking layer at a time, you can use the data themselves to constrain the positioning accuracy! This is brilliant, but of course it costs - you will be throwing away a fraction of the data to reduce systematic uncertainties. Of course this involves a trade-off between amount of data used for systematic uncertainty reduction and resulting measurement precision. On the other hand, if you spent more money on more precise hardware for positioning, you can renounce to a part of this data-greedy procedure. There is the other co-design element in this example, which makes it rich enough that we can learn something useful.
In fact, I have already worked out such an example in an optimization study I performed back in 2020 (!). Back then I was not thinking in terms of co-design, but I could still prove that those parameters, jointly optimized, could win a full factor of two in the accuracy of the final measurement. So I basically already know that this example works, but now I will have to work it out with this different pitch in mind!
So there - this is what was going on in my mind today.


Comments