Banner
Is Global Warming really a recovery from regional cooling?

This page is a rewrite of the page that was here a few days ago, I had some issues with getting...
Guest comments on GCMs and Global Warming from Prof Robert G Brown Of Duke University

Professor  Robert G Brown of Duke University makes a number of significant points at WUWT...

An Analysis Of Night Time Cooling Based On NCDC Station Record Data

Since posting this I have discovered that the difference signal I was looking at was not daily...

Cosmic Ray Detecting Thermometer

CMOS Imaging sensors are the sensor of choice for most consumer digital cameras. They tend to be...

User picture.
picture for Hank Campbellpicture for Quentin Rowepicture for Chris Delatorrepicture for Helen Barrattpicture for David Hallidaypicture for Ladislav Kocbach
Mi CroRSS Feed of this column.

Integrated Circuit Failure analysis. Published article on using Liquid Crystals on integrated circuits as a trouble shooting aid. 14 years as a Electronic Design Automation application engineer,... Read More »

Blogroll
Well, only if you intentionally ignore all of the data you have.
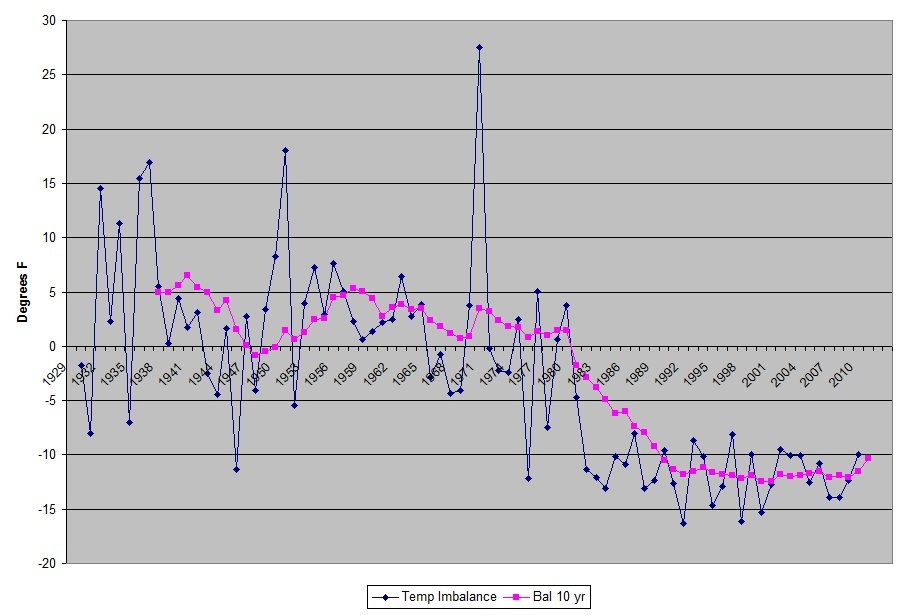
Land based station average temps since 1980:
I found a problem where the original data from NCDC lost the tenth of a degree place during importing. So I corrected this problem and regenerated my graphs.
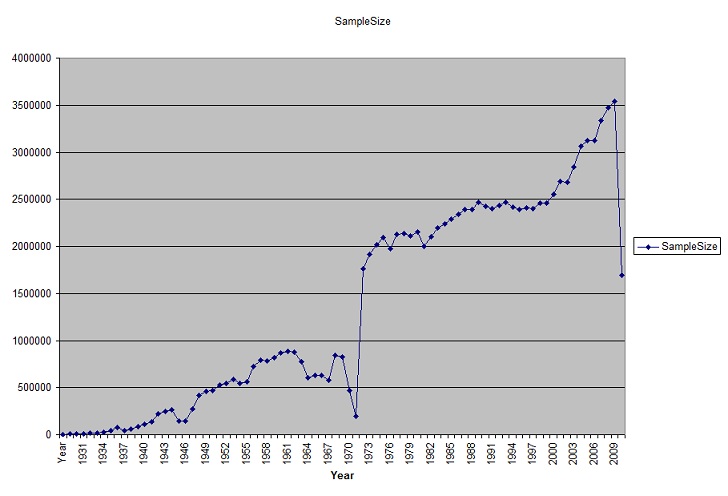
Also based on emails with Dr Roy Spencer, he suggested that I remove stations that are not present through the majority of the time period analyzed. This was done for NH,SH and Tropics charts, where to be included the station had to have 240 days of data over at least 40 years from 1940-2010.

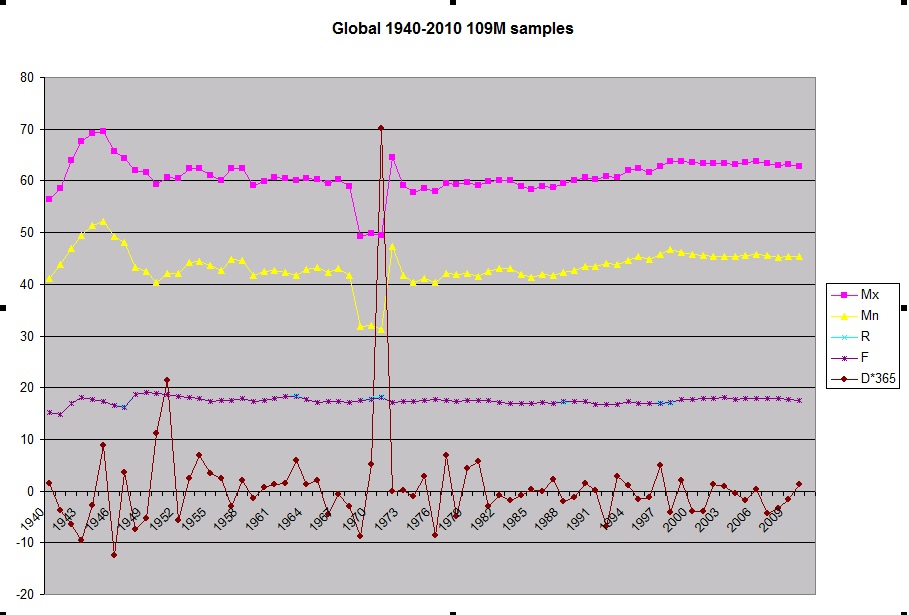
These are the updated graphs.
Global averages all stations:
The Integrated Surface Database http://www.ncdc.noaa.gov/oa/climate/isd/index.php  is a joint project of the National Climatic Data Center, the Navy, and the Air Force, and is a combination of over 100 data sources http://www.ncdc.noaa.gov/oa/isosmtg/lott-isos-ncdc-isd.ppt .

In the first blog on this data
http://www.science20.com/virtual_worlds/blog/global_annual_daily_temperatures_19292010-81063
While standing outside in the middle of a cold night tending my telescope, I started wondering about how much heat is getting radiated into space under clear skys, that increases in CO2 should be reducing that radiation, and whether or not it would be detectable in temperature records.

I dug around on NOAA's data site looking for hourly data thinking I could get some rate of change data from say the 30's and compare that to current data. Unfortunately, that data isn't free. I did find I could download their Global Summary of Days data.

Free is free, so what the heck.