


In the first blog on this data
http://www.science20.com/virtual_worlds/blog/global_annual_daily_temperatures_19292010-81063
I included a graph that starting in the early 80's has a -10F imbalance, where 10 degrees more heat is lost over night than we received during the previous day.
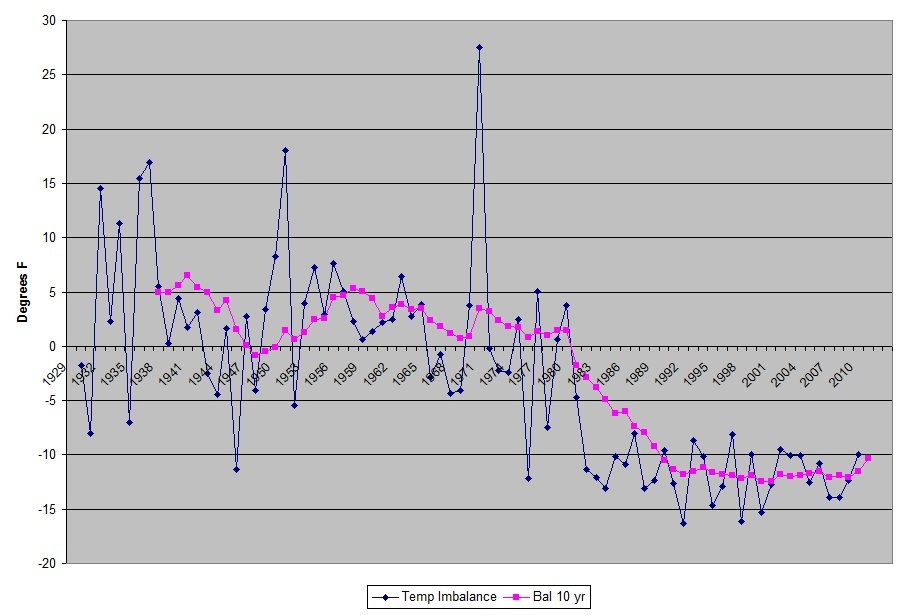 It's easy to wonder how that is even possible, and nothing more than a processing artifact. Yet, prior to 1982, there's a nice randomness in the data, No signs of any processing artifacts. Maybe a sampling size issue? Except the number of active sites went way up in 1973-1974, 10 years earlier.
To help verify this, I decided to review the data on a monthly basis, that way I should be able to detect seasonal changes. But to get the seasons, I had to split the averages up based on location. So I selected 23 degrees Latitude as my dividing line, 23N, 23S, and between 23N/S as the tropics.
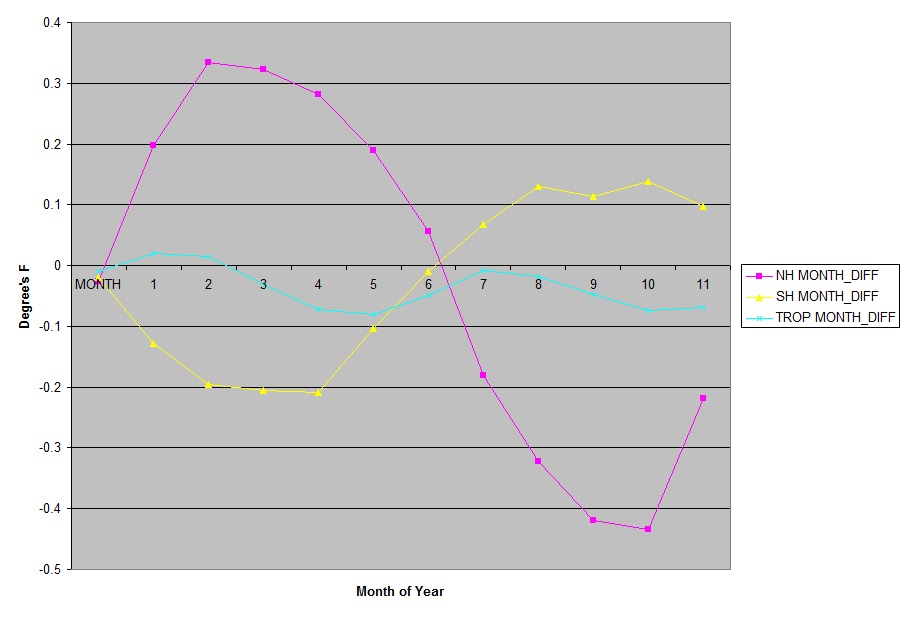 This shows the Seasonal variation quite well, and gives some validation that this idea of measuring the imbalance gives meaningful answers.Unfortunately, it doesn't come with a Theory of Operation.To see if the imbalance was due to measurement/equipment issues, I split both the yearly average and the yearly daily imbalance by Latitude (N,S,T)
Here's Todays and Tomorrows Annual low temp averages for N,S,T where you can see different trends based on Lat.
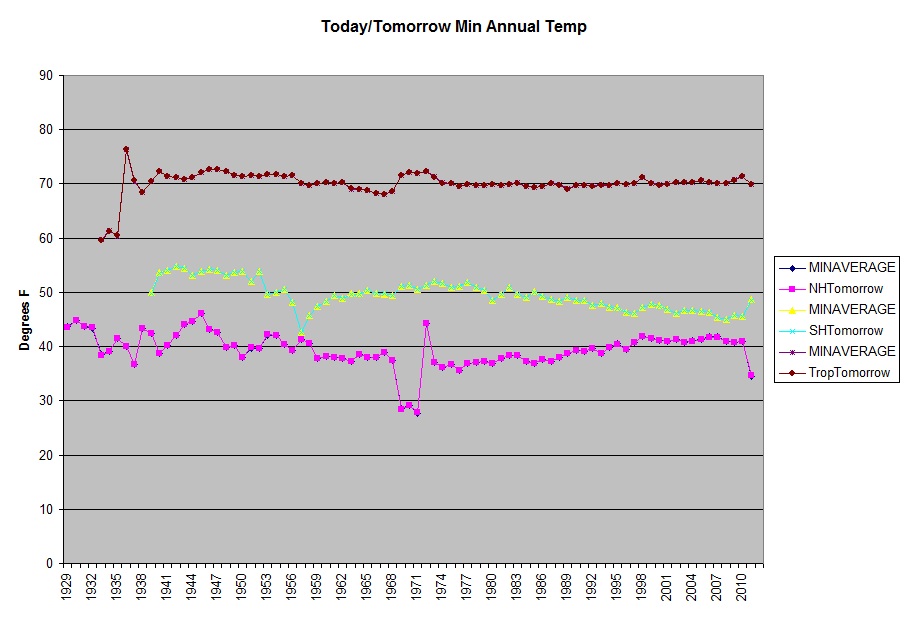
It's interesting to note that NH temps start rising in the 70's, yet Tropic temps hold flat, and SH temps decline.
Then the NST daily imbalance. Where you can see N/S Hemisphere temps both show the negative imbalance in the early 80's, and the Tropics go negative in ~76.
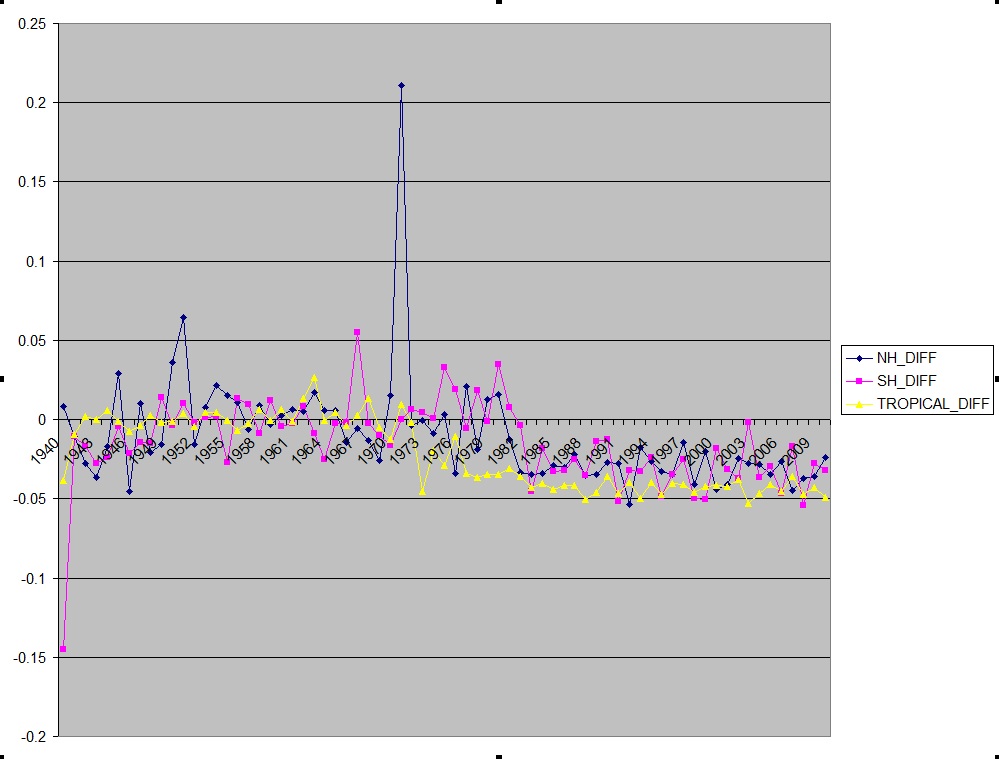
Something happened to the ISD data in the early 80's, and it looks like it's a real effect in the data.


Comments