


I dug around on NOAA's data site looking for hourly data thinking I could get some rate of change data from say the 30's and compare that to current data. Unfortunately, that data isn't free. I did find I could download their Global Summary of Days data.
Free is free, so what the heck.
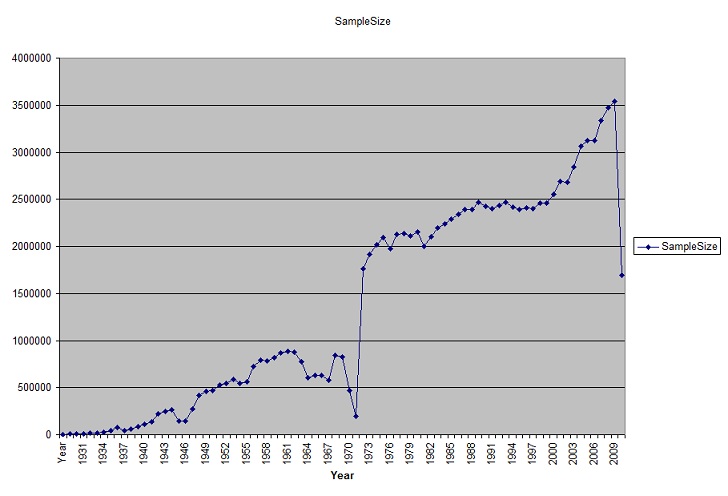
GSOD data consists of year by year records going back to 1929 for weather stations around the globe, some 426,000 station reports, 112 million daily records for 29,903 calendar days.
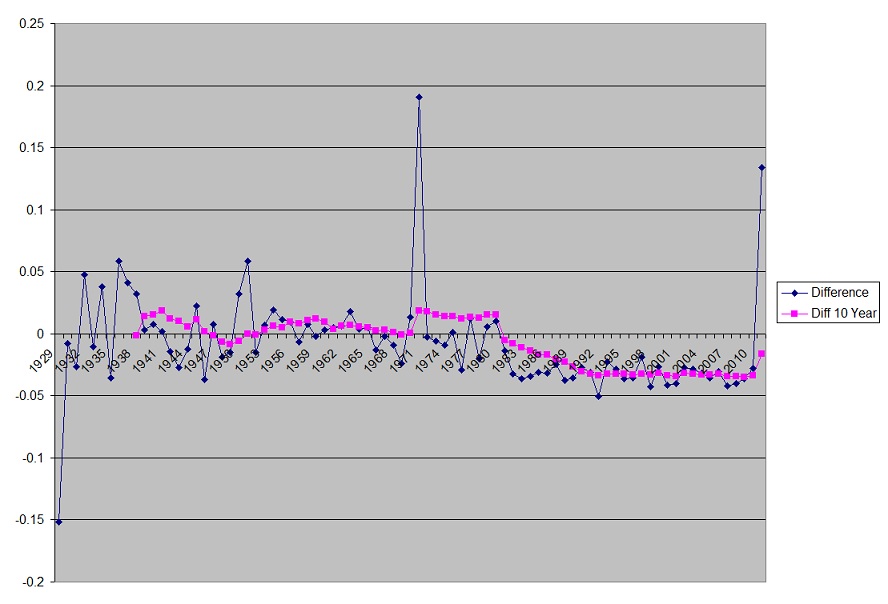
The methodology I used was to take the daily maximum temperature, and subtracted the morning low temperature. That provides the energy into the planet, I then took the Max temp, and subtracted tomorrow mornings low temp, which gives me the energy lost overnight.
I originally wanted to mine the data for clear nights, but decided that there were to many ways for that to go wrong, and would never be untainted.
So, I process everyday that meets the following criteria:
The Min and Max temps for today, and tomorrows low are in the range of 199 to -199.
The record set uses 10000 on days that the temp is missing.
A record exists in the data for tomorrow.
You can see from the sample count, there are some years that have a lot more data than others, I would expect there to be a range of quality in the data.
According to this:
http://www7.ncdc.noaa.gov/CDO/GSOD_DESC.txt
Global summary of day data for 18 surface meteorological elements
are derived from the synoptic/hourly observations contained in
USAF DATSAV3 Surface data and Federal Climate Complex Integrated
Surface Data (ISD).
Or more simply it's what I have.
Once I have this filtered data(112,426,376 samples), I can generate various graphs.
One of first was an Annual Average of the daily Temperature Increase and Cooling for all stations. And was amazed at how close the 2 values were, all the while changing every year.

I then did one of the difference between them.
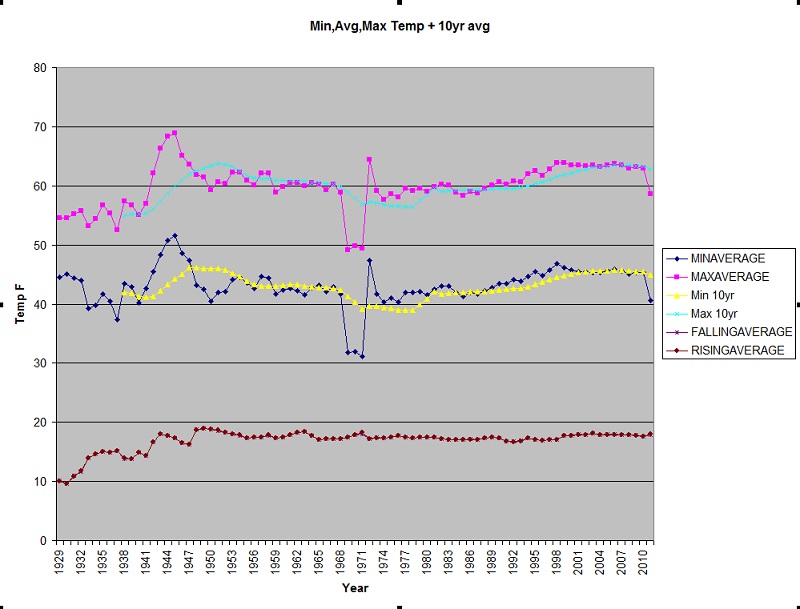
And then lastly, The Min and Max temps plotted along with the rising and falling data.
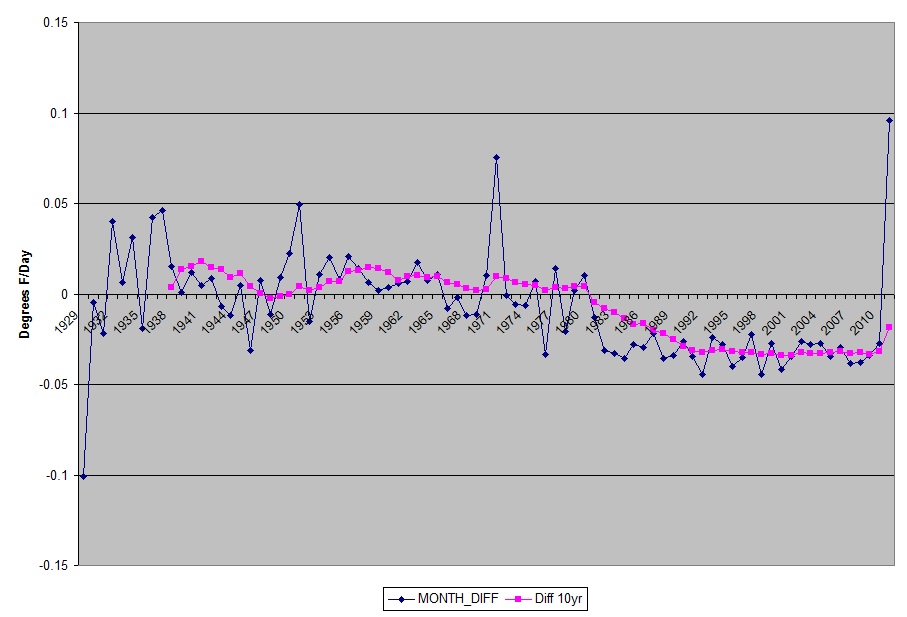
If you calculate the radiation balance over the 80 some years, there is over all a -0.0198 degree F/Day (Edited to add '/Day') imbalance, where it's a little colder tomorrow morning than it was today.
I'm working on some Monthly averages where you can see Rising and Falling values change with the seasons.
*Edit. I updated the graphs of the averages. The new ones I Average the days value from all of the stations into one value, then I average the 365 days per year, this ways Days get the correct weighting.
I decided to just add the new graphs.


The sql code/data can be made available for anyone wanting it, export restriction applicable.


Comments