

The Nares ice bridge is still blocking the strait. My forecast of breakup on April 07 ± 3 days was wrong. A forecast is only as good as the assumptions it is based on. My forecast was based on valid assumptions, but I missed something vital: the 'plug' in the ice bridge isn't just consolidated ice: it is homogenous ice. It is likely also that it is less salty than ordinary first year sea ice. That would mean that the ice bridge is much stronger than average.
After the flow of ice towards Baffin Bay came to a virtual halt, ice formed downwind of the ice jam. Such ice is normally blown away by the wind into warmer waters where it melts. When the Nares ice bridge forms at the other end of Kane Basin, or near Petermann Glacier, the resulting polyna is longer and more capable of melting fresh ice. Accordingly, there is less chance of a truly solid plug of ice forming.
This year, new ice which formed near the ice jam remained in place, thickened and was blown back against the ice jam to form a very substantial ice plug - the ice bridge proper. Considering the amount of snow and ice which had been melting in the area and the fact that warmer, less saline water tends to form a layer over colder, denser, more saline water, it is likely that this plug is formed from less saline waters than most sea ice.

The 2011 Nares ice bridge forming in Kane Basin
In previous years when the ice bridge formed in the same location as this year the ice bridge did not allow melt out and full mobility in the Nares Strait until about the end of June, and sometimes early July. Based on the ice bridge being formed merely of consolidated salty ice floes glued together with fresh ice, and based on the state of the ice following the warm winter of 2010-2011, I had wrongly assumed a very early melt of the ice bridge.
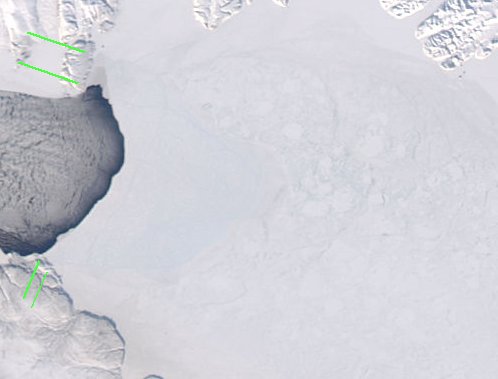
The Nares ice bridge anchor points
The green lines in the image above show the anchor points of the ice bridge. At the top a roughly triangular area can be seen which shows melting and refreezing. This is the strongest anchor point. At the bottom, the anchor point is relatively small. The ice plug is jammed solidly against an island. Once the ice can move there due to melting around the island, the whole plug will be free to rotate anticlockwise. There are already many fissures in the ice plug kept closed by pressure. Once the ice moves it is very likely to break up in less than a day.
My amended assessment is that unless the ice bridge is broken up by violent winds, it will break up some time in May. Given that regional melt events in the Arctic are tending to occur ever earlier, I consider it most unlikely that the ice bridge will survive into June.
Petermann Glacier
The large fissure in Petermann Glacier now extends across its full width. ASAR images show hints of fissures further back. Once the sea ice has melted out in Petermann Fjord, the new ice island will calve as soon as a strong enough wind blows down the fjord. This is likely to occur by late July. I hope to post an updated prediction in another Arctic Ice report.
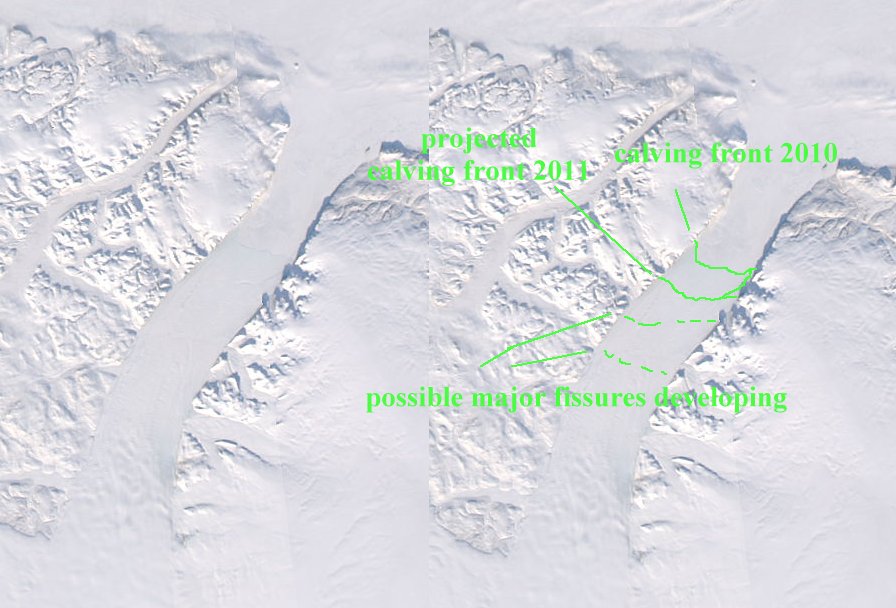
Petermann ice tongue April 14 2011
The dashed lines correspond to features which are intermittently visible in ASAR images. Provided that these are not image processing artifacts - and I suggest that they are not - then there are fissures forming across the ice tongue which will eventually become new calving fronts.
The area of the projected 2011 ice island will be about 200 km2. Once it has calved and its back-pressure no longer affects the ice tongue, the other fissures will be free to expand laterally, when they will become more prominent.
Petermann Fjord tapers towards the point where the calving front was in 2009-2010. With the 2010 ice island removed from that bottleneck, it seems likely that there will be substantially less back-pressure on areas near the new calving front. The ice tongue is held back only by winter sea ice and by a jumble of ice at its edges, most fragmented on the northern edge. I consider it likely that each new calving will allow the ice to move forward in a brief spurt until the new calving front is jammed across the fjord. From that point, lateral expansion will cause the jamming to increase back up the fjord. Any substantial fissure across the ice tongue near the calving front will result in a large calving event once either or both of the jumbled ice margins is loosened sufficiently by surface and bottom melt and by meltwater penetration.
North West Passage - NWP and Canadian Archipelago - CA
Judging from the current state of the ice and the current weather patterns, the whole NWP and the passages through the CA will melt out this year as they did last year. The melt out of the NWP will likely be about 2 weeks earlier than 2010. In terms of a navigable NWP, that would be about the end of July.
Bering, Chukchi, Beaufort and East Siberian seas
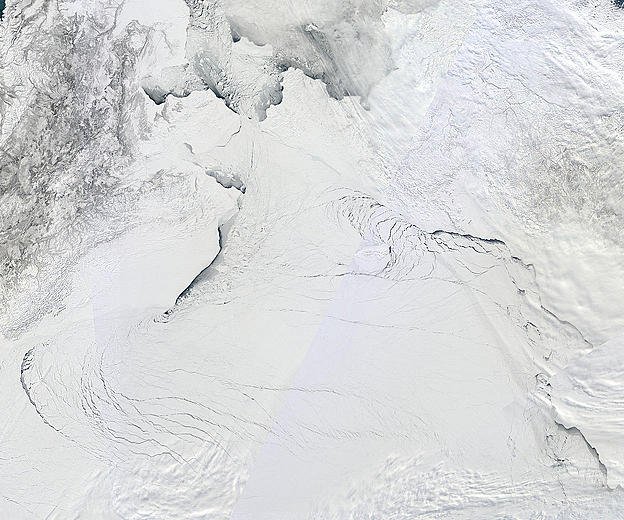
There is currently a great deal of ice movement in all of these areas, with fissures extending from the Beaufort Sea well into the Arctic Basin. The ice in these areas is mostly young ice less than 2 meters thick, except where piled up on shores.
March 2011 Sea Ice Summary from Sivuqaq/Gambell
The ice pack [at Gambell] is different thus far compared to that of the past. It is generally agreed that it has a poorer quality, probably from mostly fluctuating temperatures; storms; and not fully developing, as it has before, into thicker ice. It is in all probability prone to rapid melting with the coming of warmer spring climates. The Siberian lead [between St. Lawrence Island and Siberia] has been open as well with the ice pack drifting beyond the horizon at least a couple of times. The shorefast ice was broken off from the Qitelnguk, Devleghaq, and Aqeftapak bays [along the north shore, around Cape Sivuqaq] around the first of the month of March and remains open to date.
http://www.arcus.org/search/siwo
Fissures in Arctic ice mid April 2011
Laptev, Kara and Barents Seas
As the Kara Sea and the Barents Sea lose ice to open water it is replaced by ice moving out from between the many islands in the area. Although this tends to maintain the extent in those seas, the ice becomes more broken and thinner.
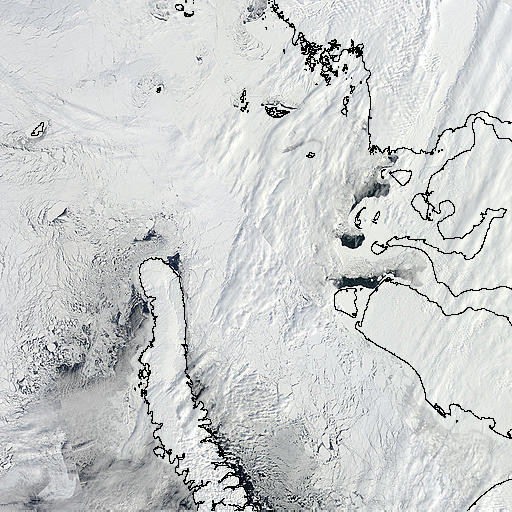
Ice moving from land into Laptev and Kara seas
The ice in the Kara, Barents and Laptev seas is holding up in extent as ice breaks up, but the extent will drop sharply when the melt season gets fully under way.
Forecasts:
My forecasts posted in March were wrong:
Arctic Ice March 2011 Update #2 March 24th 2011Here are my amended forecasts taking account of a later break-up of the Nares ice bridge:
Dates given should be taken as plus or minus 3 days.
The Nares ice bridge will be fragmented, and the ice in Kane Basin will be melting out by April 7th.
Ice from Lincoln Sea will be advecting through Nares Strait by April 14th.
The main North West Passage ice will show strong evidence of breakup and melt by April 30th.
By April 30th, ice extent graphs will show a strong downward trend similar to that of May - June 2010.
The Nares ice bridge could hold out for 2 to 3 more weeks. It is more difficult to predict the break up of a solidly wedged homogenous ice mass than an aggregate held together mostly by uniform pressure.
It will take about 7 days after the ice bridge breaks up for the ice to be advecting from Lincoln Sea through Nares Strait.
My prediction for ice extent to trend downwards by April 30th does not depend on activity in Nares Strait and remains unchanged.
Petermann glacier will calve an ice island about 200 km2 by late July.
The North West Passage will be navigable by the end of July.
September minimum
Using AMSR-E data from IJIS-IARC, link below, I have projected possible melt scenarios. The melt patterns of 2003-2010 from April 04 of each year to minimum extent were appended to the 2011 data at April 14. The method determines what the extent will be IF the behavior of the Arctic mimics a particular year. Here are listed in projected order the recorded extent for the year and the projected extent for 2011 in terms of that year's behavior:
year ......... recorded ..projected
09,29,2006, 5959219, 6331250
09,12,2004, 5806719, 5910781
09,18,2003, 6032031, 5455468
09,22,2005, 5315156, 5376564
09,13,2009, 5249844, 4891719
09,24,2007, 4254531, 4469218
09,10,2010, 4952813, 4379375
09,17,2008, 4718594, 4275781
The 2007 melt season was unusual in that conditions generally favored ice loss.
The 2010 melt season was unusual in that at the end of June, conditions began to favor ice retention.
If ice melt conditions this year fall between those of early June 2010 and those of 2007, then ice extent will likely fall well below the 2008 level, otherwise 2008 is likely to be equaled.
I project an end of season extent range between 3.9 million km2 and 4.5 million km2.
-------------------------------------------------
Image sources:
http://ocean.dmi.dk/arctic/images/MODIS/
http://rapidfire.sci.gsfc.nasa.gov/
Data source:
http://www.ijis.iarc.uaf.edu/seaice/extent/plot.csv
Further resources:
Arctic Sea Ice Blog
arctic sea ice graphs
Related articles:
http://glacierchange.wordpress.com/2010/03/27/petermann-glacier/
An Arctic Decade 2001 - 2011
Arctic Ice 2011 - Sail, Steam And Satellites
Arctic Ice March 2011
Arctic Ice March 2011 - Update #1
Arctic Ice March 2011 Update #2
ice-in-baffin-bay
The ChatterBox Arctic Index


Comments